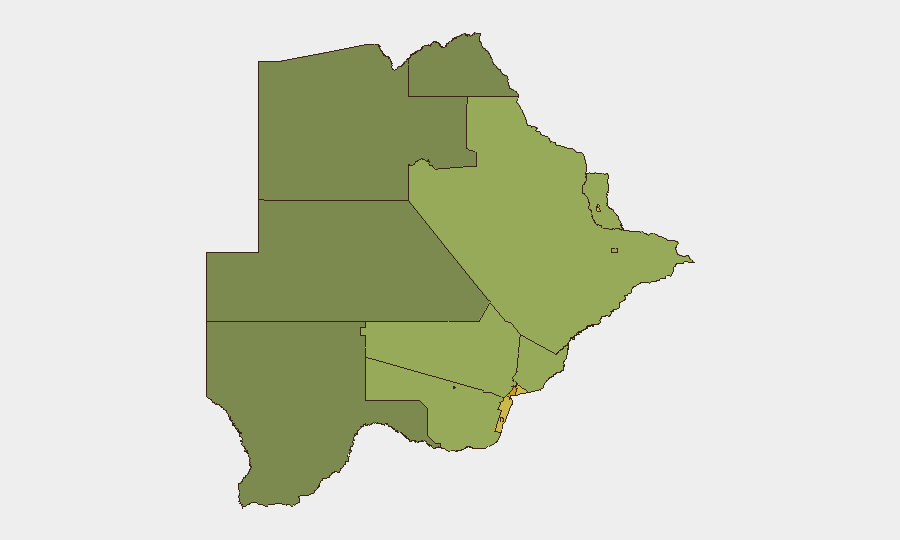
Situation Summary
Botswana maintains a stable security environment with no confirmed acute incidents, civil unrest, or political-violence events reported in the last 24–48 hours across monitored news, broadcast, and social channels. The country's composite threat score remains low (3/100) relative to global peers, reflecting historically consistent governance and low organized-crime activity. Two active wildfires are under management but do not currently pose direct security threats to urban centres or major infrastructure. The operating environment for personnel and assets remains benign, though localized crime and community-tension dynamics warrant routine duty-of-care attention in higher-risk urban zones.
Key Developments
- No acute security, civil unrest, or political-violence incidents reported – 19–20 June 2026 – Countrywide monitoring across open news, broadcast, and social sources confirms absence of reportable incidents in the last 48 hours.
- Wildfire activity (ongoing management) – Location: Botswana (national extent, specific zones under active suppression). Two tracked wildfire events (IDs 1028958, 1028971) remain subject to containment; no current threat to populated areas or critical infrastructure reported.
- Background: Mogoditshane community tensions – Historical monitoring has documented tensions between Batswana residents and Zimbabwean nationals in Mogoditshane; no new incident corroboration available for 19–20 June period. This reflects an ongoing social dynamic rather than an acute trigger event.
Highest-Risk Areas
Gaborone, South-East District, Lobatse, and Francistown drive the sub-national ranking, with composite risk scores ranging from 72 to 62. These urban centres concentrate commercial activity, informal-settlement populations, and cross-border labour migration, creating conditions for petty crime, street robbery, and interpersonal violence—the primary threat vectors in Botswana. Gaborone's score reflects its role as the capital and primary commercial hub; South-East District and Lobatse (diamond-mining regions) show elevated risk linked to transient populations and cash-based economic activity. Mid-tier towns including Jwaneng and Selebi Phikwe remain relevant for similar reasons. Northern and western districts present materially lower risk due to lower population density and reduced criminal opportunity.
How GeoBit Would Assist
Security teams operating in Botswana should employ Intel Sweep and multi-language OSINT feeds to maintain real-time awareness of civil unrest, crime trends, and cross-border incidents, particularly in Gaborone and South-East District. AOI Monitoring & Early Warning (persistent watch on high-risk zones with automated alerting) would enable duty-of-care teams to detect emerging crime clusters or community-tension escalation before they impact personnel movements or asset security. Routing & Network Analysis supports alternative journey planning for staff in high-risk urban areas, reducing exposure to crime hotspots during commute and off-duty hours.
7-Day Outlook
No material escalation of security risk is anticipated in the next seven days. Botswana's institutional stability and absence of organized political or sectarian triggers suggest the benign environment will persist. Wildfire containment efforts should proceed without material disruption; monitoring of seasonal weather and cross-border dynamics remains routine. Teams should maintain standard duty-of-care protocols in urban centres and report any anomalies in local crime patterns or civil order to regional security leadership.
Highest-Risk Areas — Ranked
| # | State / Region | Risk |
|---|---|---|
| 1 | Gaborone | 72 |
| 2 | South-East District | 68 |
| 3 | Lobatse | 65 |
| 4 | Francistown | 62 |
| 5 | Jwaneng | 61 |
| 6 | Selebi Phikwe | 58 |
| 7 | Southern District | 55 |
| 8 | Kgatleng District | 50 |
| 9 | Kweneng District | 48 |
| 10 | North-East District | 45 |
| 11 | Central District | 42 |
| 12 | North-West District | 38 |
Sources
Previous Daily Briefs
A new Botswana brief is written every day — each with its own risk map and downloadable CSV. Here's the last week; use the calendar to go further back.
📅 Browse every day by calendar →
Highlighted days have a brief. Tap a day for that day's map & analysis, or “csv” for that day's dataset ($5).