Situation Summary
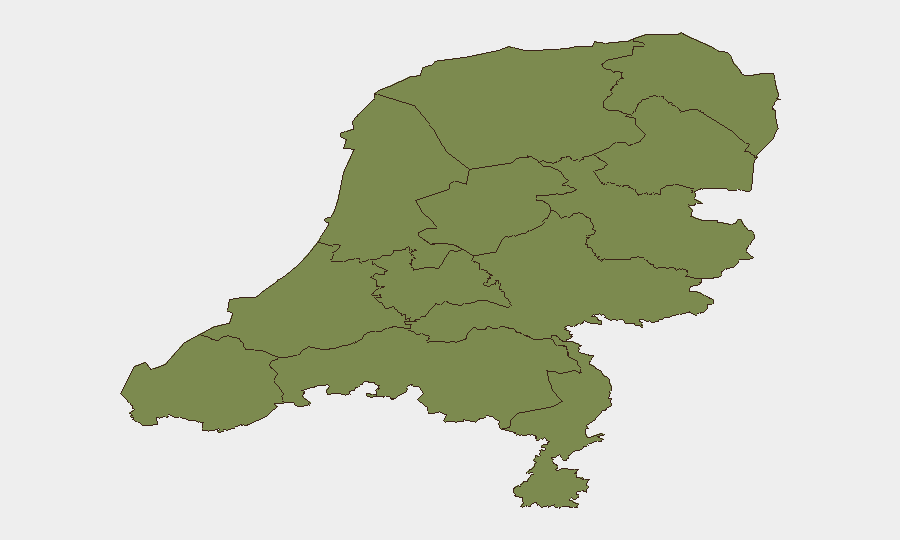
The Netherlands maintains a composite threat score of 5 (rank #139 globally), indicating a low-threat operating environment relative to global peers. The past 48 hours show scattered police investigative activity, one expulsion case, and isolated small-arms incidents without clear pattern or escalation. Risk concentration remains acute in Flevoland (score 31.5), where threat density is substantially elevated relative to other provinces; Groningen follows at score 9. The overall security trajectory remains stable with localized volatility.
Key Developments
- 2026-06-20 · Small Arms Combat · Deputies (location unspecified). Law enforcement engaged in armed incident; context and location not yet clarified in available reporting.
- 2026-06-20 · Conventional Military Force · European (location unspecified). European-level military activity noted; scope and specifics require confirmation.
- 2026-06-19 · Conventional Military Force · Netherlands (location unspecified). Dutch military activity recorded; no escalation indicators in current data.
- 2026-06-19 · Investigate · Amsterdam vs Employee. Police investigation initiated against an employee in Amsterdam; details and category not specified.
- 2026-06-18 · Expel/Deport · Residents vs Male. Deportation or expulsion action involving a male; residential context suggests potential migration or asylum-related incident.
- 2026-06-18 · Small Arms Combat · Hyundai (location unspecified). Armed incident with vehicle reference; details insufficient for risk classification.
Note: Live web research did not confirm secondary corroboration of these 48-hour event signals through independent Dutch media or official sources. Availability of corroborating open-source reporting is limited.
Highest-Risk Areas
Flevoland dominates the sub-national risk profile with a composite score of 31.5—more than three times the risk of Groningen (9.0) and substantially higher than remaining provinces (all ≤7.2). This concentration suggests either higher incident frequency, severity clustering, or underlying structural risk drivers in Flevoland warranting focused investigation. Groningen and North Holland follow at secondary tier (scores 9 and 7.2), while all other provinces remain below 2.7. Risk outside the top three provinces is negligible and diffuse.
How GeoBit Would Assist
Intel Sweep across Dutch law enforcement, municipal, and regional media sources would establish real-time corroboration of the event signals above and fill gaps in incident context (location, actors, motive). AOI Monitoring & Early Warning with persistent watch over Flevoland and Groningen would detect emerging patterns before broader escalation and generate automated alerts on high-consequence event types. Network & Actor Analysis would map relationships between the scattered police investigations and expulsion cases to identify whether incidents reflect organized activity or random occurrence—critical for duty-of-care planning. Routing & Network Analysis would support alternative-route planning for personnel or supply chains if localized security incidents spike in monitored provinces.
7-Day Outlook
No indicators of near-term escalation are visible in current data; the environment is expected to remain stable at composite threat level 5. Continued monitoring of Flevoland is warranted given sustained elevated risk score. Security teams with personnel or assets in the Netherlands should maintain standard vigilance protocols and confirm up-to-date emergency contact networks, particularly for staff in high-risk provinces.
Highest-Risk Areas — Ranked
| # | State / Region | Risk |
|---|---|---|
| 1 | Flevoland | 31.5 |
| 2 | Groningen | 9 |
| 3 | North Holland | 7.2 |
| 4 | North Brabant | 2.7 |
| 5 | South Holland | 2.1 |
| 6 | Zeeland | 1.5 |
| 7 | Utrecht | 1.5 |
| 8 | Frisia | 1.5 |
| 9 | Drenthe | 1.5 |
| 10 | Gelderland | 1.5 |
| 11 | Overijssel | 1.5 |
| 12 | Limburg | 1.5 |
Sources
Previous Daily Briefs
A new Netherlands brief is written every day — each with its own risk map and downloadable CSV. Here's the last week; use the calendar to go further back.
📅 Browse every day by calendar →
Highlighted days have a brief. Tap a day for that day's map & analysis, or “csv” for that day's dataset ($5).