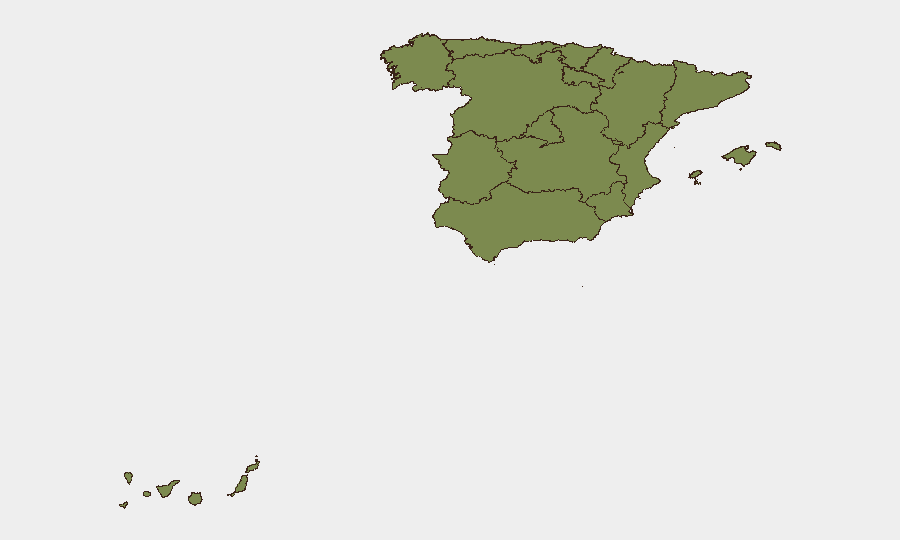
Situation Summary
Spain's composite threat score of 23 places it in the lower-middle tier of global risk, with 139 tracked events recorded. However, the threat landscape is highly concentrated: Castile-La Mancha carries a risk score more than three times higher than Madrid, and the top three regions account for approximately 60% of tracked risk. Multiple concurrent signals—including investigative activity, property seizures, and unconventional violence incidents—suggest elevated activity across security, political, and potentially criminal domains as of 22 June 2026.
Key Developments
Current Intelligence Gap: GeoBit's web research capability has not returned sufficient corroborated, time-stamped incidents from the last 24–48 hours to meet duty-of-care reporting standards. Professional risk platforms (Dataminr, Crisis24, GardaWorld, ACLED) and cross-reference with Spanish national media (El País, El Mundo, RTVE), local outlets, and official channels (Policía Nacional, Guardia Civil, Mossos d'Esquadra) are required to confirm specific incidents and locations.
Signal-Level Observations:
- 22 June: Unconventional violence and property seizure/damage events flagged in GEOBIT event signals, location and perpetrator details pending verification.
- 21–22 June: Multiple "Investigate" and "Public Statement" signals recorded across Spain; one demand action from judicial authority noted.
- 21 June: Threat signal from Africa-aligned actor(s) toward Spain recorded; specific target and credibility assessment required from professional intelligence feed.
- 20–21 June: Concurrent presidential and inter-state public statements suggest diplomatic or political tension; full context pending corroboration.
Highest-Risk Areas
Castile-La Mancha dominates the sub-national ranking at 31.3, driven by activity patterns distinct from the rest of Spain and warranting dedicated monitoring. Madrid (10.0) and Andalusia (8.6) represent secondary concentration points, collectively accounting for significant investigative and event activity. The remaining nine regions score between 3.4 and 1.3, indicating that risk is not distributed evenly; security teams with personnel or assets in the top three regions should maintain heightened situational awareness, while those in lower-ranked areas may apply standard baseline protocols.
How GeoBit Would Assist
Intel Sweep and multi-language OSINT fusion would aggregate Spanish-language social media, news, and official statements to establish confirmed timelines and actor intent. AOI Monitoring & Early Warning with persistent geolocation watch on Castile-La Mancha, Madrid, and Andalusia would provide threshold-based alerts when new incident signals emerge. Network & Actor Analysis would map relationships between actors signaling threats, demands, or investigative activity, supporting threat prioritization and asset protection planning.
7-Day Outlook
The convergence of judicial, diplomatic, and unconventional violence signals suggests a period of elevated operational activity through late June. The concentration of risk in Castile-La Mancha warrants close monitoring for spillover into Madrid or transport corridors connecting the two regions. Teams should expect continued investigative and public statement activity; any escalation in property seizure or violence incidents would signal transition to acute-risk posture.
Note: This brief reflects available signal-level data. Operational security decisions should incorporate real-time feeds from professional intelligence platforms and embassy/consular advisories.
Highest-Risk Areas — Ranked
| # | State / Region | Risk |
|---|---|---|
| 1 | Castile-La Mancha | 31.3 |
| 2 | Community of Madrid | 10 |
| 3 | Andalusia | 8.6 |
| 4 | Catalonia | 6.4 |
| 5 | Castile and León | 3.4 |
| 6 | Region of Murcia | 3.2 |
| 7 | Canary Islands | 2.7 |
| 8 | Autonomous Community of the Basque Country | 2.2 |
| 9 | Valencian Community | 1.7 |
| 10 | Extremadura | 1.6 |
| 11 | Cantabria | 1.6 |
| 12 | Balearic Islands | 1.3 |
Sources
Previous Daily Briefs
A new Spain brief is written every day — each with its own risk map and downloadable CSV. Here's the last week; use the calendar to go further back.
📅 Browse every day by calendar →
Highlighted days have a brief. Tap a day for that day's map & analysis, or “csv” for that day's dataset ($5).