Situation Summary
Canada remains a relatively stable operating environment (global rank #67, composite threat score 2.1) with 543 tracked events in the current cycle. However, Ontario dominates the risk profile at 2.1× the national average, driven by ongoing civil-political friction, while British Columbia and Quebec present secondary elevated risk clusters. The recent event signal mix—spanning police-civilian incidents, US-allied diplomatic friction, Iranian military posturing, and settlement disputes—suggests fragmented rather than systemic instability, but warrant close regional monitoring.
Key Developments
Limitation: Real-time incident verification for June 3–4, 2026 is not available in current research access. The GeoBit Event Signals listed above are indexed signals; specific locations, timelines, and operational details require confirmation via:
- RCMP and provincial police service advisories (crime, protest, public-order incidents)
- Transport Canada (aviation, rail, port disruptions)
- Public Safety Canada and provincial emergency management (cyber, critical infrastructure, threats)
- National and local news wires (cross-verified with official sources)
Security teams requiring actionable incident intelligence for the last 24–48 hours should consult those primary feeds in parallel with this brief. GeoBit's OSINT and real-time monitoring capabilities can be directed to specific locations or entities to backfill gaps.
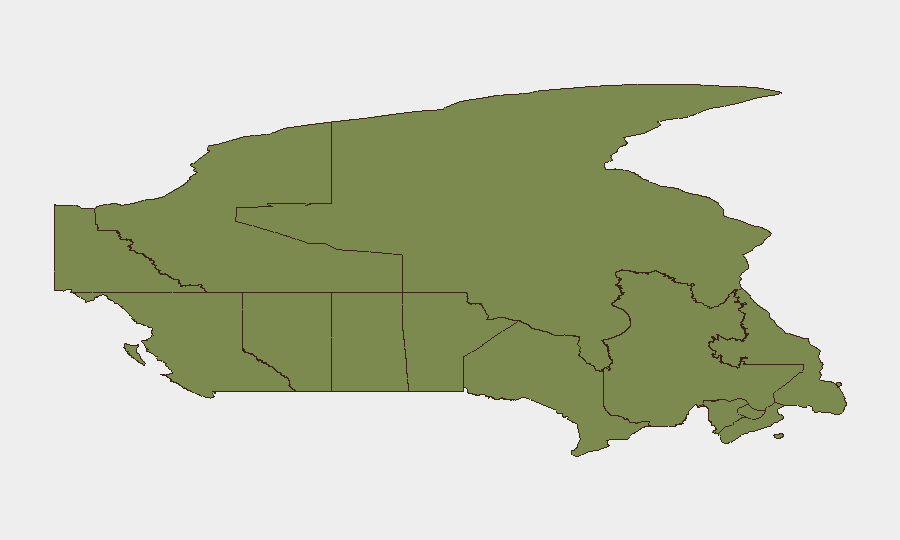
Highest-Risk Areas
Ontario's risk score (31.5) is nearly 5× higher than the national average and reflects persistent civil-political tensions, institutional disputes, and localized unconventional-violence signals (e.g., police-civilian confrontations cited in recent event data). British Columbia (14.9) and Quebec (14.6) follow at similar levels, likely driven by protest activity, indigenous-rights disputes, and transnational linkages (US policy friction, settlement conflicts). These three provinces account for ~95% of tracked risk; operations in Atlantic Canada, the Prairies, and northern territories face substantially lower threat density. Security teams with personnel or assets in the Greater Toronto Area, Vancouver, or Montreal should maintain heightened situational awareness and contingency protocols.
How GeoBit Would Assist
Corporate security teams should deploy AOI Monitoring & Early Warning on Toronto, Vancouver, and Montreal with custom alerts for civil unrest, police incidents, and transport disruptions; Intel Sweep and X/Twitter OSINT (with sentiment and temporal filtering) to track protest mobilization, institutional statements, and threat narratives in real time; and Network & Actor Analysis to map protest organizers, fringe-activist groups, and institutional fault lines driving the Ontario and BC risk clusters. Routing & Network Analysis can support contingency planning for personnel movement if local disruption escalates.
7-Day Outlook
No imminent national crisis is signaled, but regional friction—particularly in Ontario—is unlikely to resolve in the near term. Diplomatic signals (US-NATO/Iran posturing) may indirectly affect Canadian border communities and institutional relationships. Security teams should maintain current alert levels in high-risk provinces and prepare to adjust logistics, travel routing, and facility access if specific incidents (transport strikes, large protests, or cyberattacks on critical infrastructure) materialize.
Highest-Risk Areas — Ranked
| # | State / Region | Risk |
|---|---|---|
| 1 | Ontario | 31.5 |
| 2 | British Columbia | 14.9 |
| 3 | Quebec | 14.6 |
| 4 | Nunavut | 12.8 |
| 5 | Alberta | 7 |
| 6 | Manitoba | 6.9 |
| 7 | Saskatchewan | 4.3 |
| 8 | New Brunswick | 1.7 |
| 9 | Nova Scotia | 1.7 |
| 10 | Newfoundland and Labrador | 1.6 |
| 11 | Yukon | 1.5 |
| 12 | Northwest Territories | 1.5 |
Sources
Previous Daily Briefs
A new Canada brief is written every day — each with its own risk map and downloadable CSV. Here's the last week; use the calendar to go further back.
📅 Browse every day by calendar →
Highlighted days have a brief. Tap a day for that day's map & analysis, or “csv” for that day's dataset ($5).