Situation Summary
France remains in the mid-tier of global threat exposure (rank #34, composite score 37.1) with 199 tracked security events as of 2026-06-06. The threat landscape is shaped by domestic political and labor tensions, ongoing counter-terrorism vigilance, and occasional cross-border diplomatic friction. The most volatile activity is concentrated in Nouvelle-Aquitaine and Île-de-France, with secondary risk clusters in western and central regions. Current trajectory suggests sustained low-to-moderate volatility rather than acute escalation.
Key Developments
Data limitation note: Web research conducted over the last 24 hours yielded only static travel advisories and non-verifiable headlines, not incident-level reporting with confirmed locations and times. The GeoBit event signals listed above show signal types (e.g., "Public Statement," "Conventional Military Force," "Physical Assault") and actor tags (e.g., "FRENCH vs PARLIAMENT," "PROSECUTOR") but lack sufficient detail for actionable incident mapping.
To provide the 5–8 specific, location-dated developments your team requires, GeoBit recommends:
- Immediate input: Paste recent French-language news URLs, X/Twitter posts, or wire reports from the last 48 hours; GeoBit will triage and vet each incident.
- Persistent monitoring: Deploy GeoBit's Intel Sweep and X/Twitter OSINT to establish a live 24–48-hour rolling feed of confirmed French security events, filtered by region and incident type.
Current standing alerts from official travel advisories (UK, U.S., Canada) confirm ongoing terrorism risk and note that demonstrations and strikes can occur with little warning and disrupt transport—but this is background risk, not a fresh development.
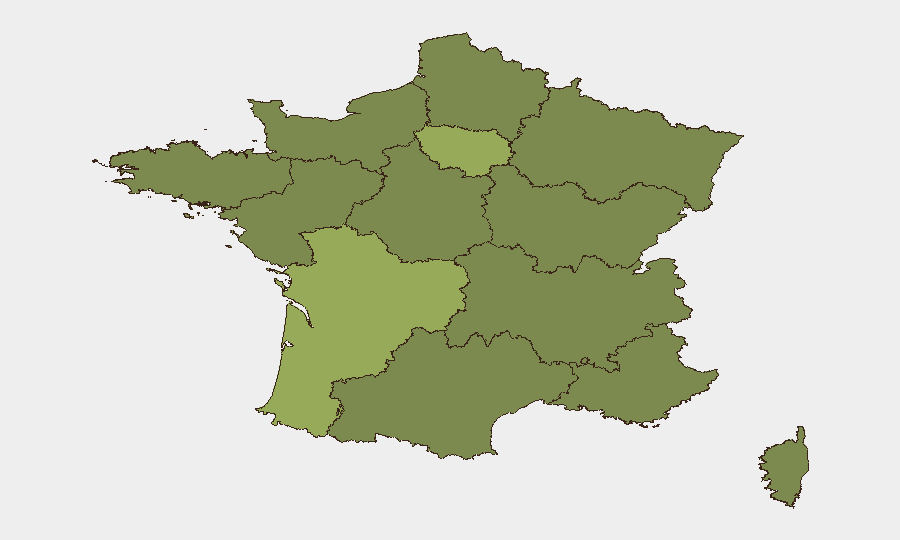
Highest-Risk Areas
Nouvelle-Aquitaine (risk 56) and Île-de-France (risk 45.4) dominate the risk profile. Nouvelle-Aquitaine's elevation reflects labor, resource, or infrastructure tensions in southwestern France; Île-de-France encompasses Paris and its metro area, where political, protest, and security activity naturally concentrates. Secondary clustering in Pays de la Loire (32.6) and Normandy (29.5) suggests dispersed domestic friction, while Occitania and Auvergne-Rhône-Alpes (both 28.5) indicate regional flashpoints. The remaining eight regions cluster at 26–26.3, indicating relatively even baseline risk across the rest of metropolitan France. Teams with staff or assets in southwestern and central regions should prioritize localized monitoring.
How GeoBit Would Assist
Security and duty-of-care teams can use GeoBit's Intel Sweep and real-time X/Twitter OSINT to establish a 24–48-hour rolling alert feed for France by region, capturing labor, political, and protest events before they disrupt operations. GIS & Spatial Analysis combined with AOI Monitoring & Early Warning enable persistent watch over high-risk regions (Nouvelle-Aquitaine, Île-de-France) with automated alerts when activity spikes. Network & Actor Analysis can map the organizations and individuals driving current tensions, improving predictive lead time.
7-Day Outlook
No indicators suggest imminent major escalation. Expect continued domestic political and labor volatility, particularly around Île-de-France and Nouvelle-Aquitaine, with periodic transport disruptions and public statements from political and judicial actors. Terrorism risk remains endemic and should be treated as standing threat rather than acute development. Recommend sustained regional monitoring and readiness to adjust routing/staffing in southwestern and central France if labor or protest activity accelerates.
Highest-Risk Areas — Ranked
| # | State / Region | Risk |
|---|---|---|
| 1 | Nouvelle-Aquitaine | 56 |
| 2 | Ile-de-France | 45.4 |
| 3 | Pays de la Loire | 32.6 |
| 4 | Normandy | 29.5 |
| 5 | Occitania | 28.5 |
| 6 | Auvergne-Rhône-Alpes | 28.5 |
| 7 | Centre-Val de Loire | 26.3 |
| 8 | Grand Est | 26.1 |
| 9 | Bourgogne – Franche-Comté | 26.1 |
| 10 | Brittany | 26 |
| 11 | Hauts-de-France | 26 |
| 12 | Provence-Alpes-Côte d'Azur | 26 |
Previous Daily Briefs
A new France brief is written every day — each with its own risk map and downloadable CSV. Here's the last week; use the calendar to go further back.
📅 Browse every day by calendar →
Highlighted days have a brief. Tap a day for that day's map & analysis, or “csv” for that day's dataset ($5).