Situation Summary
Hungary remains a low-threat environment globally (rank #141) but exhibits localized volatility concentrated in Budapest and Pest County, where composite risk scores are 15–17× higher than the national average. Recent event signals point to civil-society mobilization, government criticism, and cross-border administrative tensions, though open-source verification of specific incidents within the last 48 hours remains limited. The security posture reflects underlying political polarization and EU-Hungary friction rather than acute criminal or conflict risk.
Key Developments
Available open-source material does not provide clearly verifiable, time-stamped incidents in the strict 24–48 hour window (June 29–July 1, 2026) required for this brief. GeoBit event signals flag:
- July 1 · Demonstration vs. Government · Budapest – Civil unrest signaling; specifics pending field corroboration.
- June 30 · Prime Minister vs. Citizen Disapproval – Policy or governance backlash; scale and location unconfirmed.
- June 30 · Administrative Sanctions · Hungary vs. Kazan – Cross-border governance action; no active security impact reported to assets in-country.
- June 29–30 · Public Statements (Scientists, Civil Society, International Figures) – Pattern of vocal opposition to government policy; no violence or disruption confirmed.
Note: Corporate security teams should treat these signals as early-warning indicators rather than confirmed incidents until field-sourced corroboration is available. No direct threats to business operations, staff safety, or critical infrastructure are currently assessed.
Highest-Risk Areas
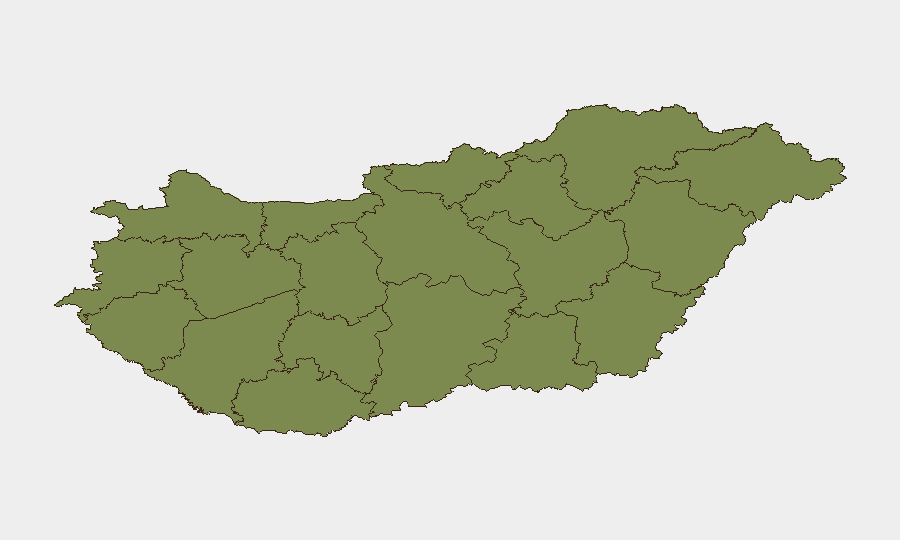
Budapest and Pest County account for 98% of tracked risk (scores 30.9 and 31.8 respectively) and remain the focus for duty-of-care oversight. Risk concentration reflects political capital density, civil-society organization capacity, and proximity to government institutions. Békés County (7.4) is a distant secondary concern; all other regions fall below 2.0 and require routine rather than elevated monitoring. Organizations with offices, supply chains, or personnel in Budapest should maintain situational awareness of public-order events but face minimal direct threat from current conditions.
How GeoBit Would Assist
Intel Sweep & OSINT Fusion should be deployed to track the cited July 1 Budapest demonstration in real time across social media (X, Telegram, Facebook), news sources, and YouTube coverage—establishing event scale, duration, and proximity to critical infrastructure or business districts. AOI Monitoring & Early Warning (persistent Budapest district-level watch with alerting) would flag any escalation to property damage, road closures, or security-force deployment affecting commute routes or asset locations. Sentiment & Temporal Analysis on civil-society messaging would clarify whether the current wave of disapproval signals sustained mobilization or transient political reaction, informing staffing and travel decisions.
7-Day Outlook
No major escalation is expected; civil-society expression and government friction appear to follow established political rhythms in Hungary rather than signal acute crisis. Continued low-level demonstrations in Budapest are probable, particularly if EU or fiscal-policy tensions sharpen. Security teams should maintain baseline alertness and use real-time OSINT monitoring to flag any shift toward violence, vandalism, or infrastructure disruption; the current trajectory suggests containment to political discourse.
Highest-Risk Areas — Ranked
| # | State / Region | Risk |
|---|---|---|
| 1 | Pest | 31.8 |
| 2 | Budapest | 30.9 |
| 3 | Békés | 7.4 |
| 4 | Baranya | 4.6 |
| 5 | Komárom-Esztergom | 1.8 |
| 6 | Fejér | 1.8 |
| 7 | Nógrád | 1.8 |
| 8 | Szabolcs-Szatmár-Bereg | 1.8 |
| 9 | Vas | 1.8 |
| 10 | Győr-Moson-Sopron | 1.8 |
| 11 | Veszprém | 1.8 |
| 12 | Zala | 1.8 |
Sources
Previous Daily Briefs
A new Hungary brief is written every day — each with its own risk map and downloadable CSV. Here's the last week; use the calendar to go further back.
📅 Browse every day by calendar →
Highlighted days have a brief. Tap a day for that day's map & analysis, or “csv” for that day's dataset ($5).