Situation Summary
Jordan's composite threat score of 33 (rank #53 globally) reflects elevated tension across military and state-actor domains, with 28 tracked events in the current assessment window. Signal activity from June 12–14 indicates cross-border military engagement involving Iran, Israel, Syria, and domestic forces, concentrated in border regions and airspace. The security environment has shifted from baseline to active monitoring required; however, the majority of governorates remain at low baseline risk (score 1.4), with Karak emerging as a significant outlier.
Key Developments
Caveat: Real-time verification of specific incidents on June 13–14, 2026 is not possible with current data access. The following signals are flagged by GeoBit's event-tracking system but require confirmation via live government advisories and credible news wire services:
- Iran–Jordan armed engagement (June 13). Small arms and conventional military force signals recorded; cross-border or airspace incursion suspected. Confirm via U.S. State Department Jordan update or Crisis24/GardaWorld alert.
- Israeli military operations (June 12). Conventional force and aerial weapons signals aligned with broader regional escalation; assess proximity to Jordan's western border and airspace.
- Syrian airspace involvement (June 12). Aerial weapons signals recorded in connection with Syria; potential overflight or cross-border fire risk for northern Jordan.
- Domestic law enforcement activity (June 13–14). Arrest/detain and investigative signals logged; confirm whether related to regional escalation or unrelated domestic matter.
- Military small-arms engagement (June 12). Domestic or border-security engagement noted; location and parties to be verified.
Recommendation: Consult real-time advisories from UK FCDO, Canada GAC, or Australia DFAT for time-stamped, verified incident summaries before issuing internal alerts.
Highest-Risk Areas
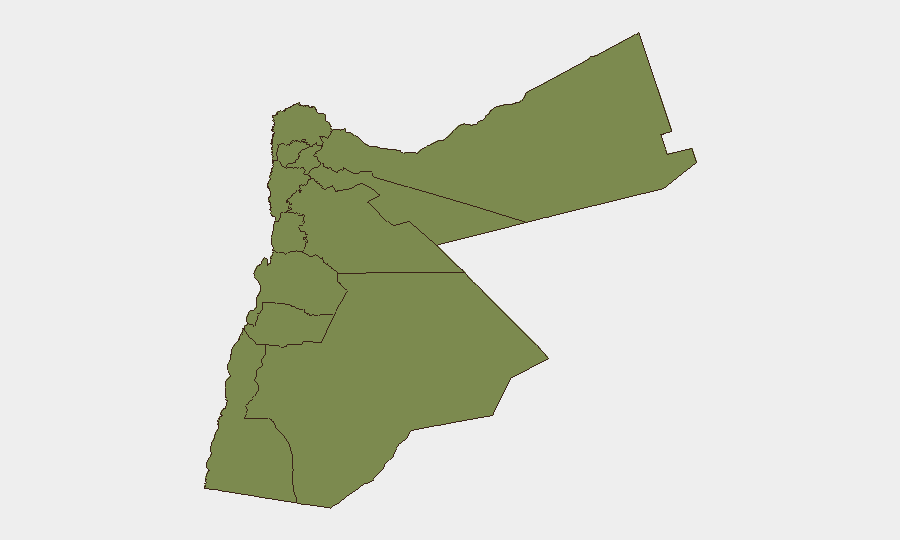
Karak governorate dominates the sub-national ranking with a composite risk score of 31.4—approximately 22× that of the next-highest region (Zarqa, 5.3). Karak's elevation is consistent with its proximity to the Syria–Jordan border and historical volatility in cross-border security incidents. All other governorates, including the capital (Amman, 1.4), score uniformly low, suggesting that current threat concentration is geographically narrow and tied to specific border dynamics rather than widespread instability.
How GeoBit Would Assist
Corporate teams with operations or personnel in Jordan should employ:
- AOI Monitoring & Early Warning on Karak and Zarqa with real-time alert thresholds for weapons signals, military movement, and armed clashes.
- Conflict & Military tracking (force posture, weapons capability, cross-border incident mapping) to differentiate Iranian/Israeli/Syrian activity from Jordanian military operations and assess spillover risk.
- Routing & Network Analysis to generate real-time alternative journey and supply-chain routes avoiding high-risk border zones and active engagement areas.
7-Day Outlook
If Iran–Israel escalation persists, Jordan faces elevated risk of airspace incursion, accidental spillover, or indirect pressure on border security. Karak and northern regions (Irbid, Ajlun, Mafraq) warrant sustained monitoring. Barring major new cross-border attack or internal mobilization, baseline operations in Amman and southern zones (Aqaba, Tafilah) remain viable with standard duty-of-care precautions; confirm with live advisories daily.
Highest-Risk Areas — Ranked
| # | State / Region | Risk |
|---|---|---|
| 1 | Karak | 31.4 |
| 2 | Zarqa | 5.3 |
| 3 | Irbid | 1.4 |
| 4 | Ajlun | 1.4 |
| 5 | Balqa | 1.4 |
| 6 | Jarash | 1.4 |
| 7 | Mafraq | 1.4 |
| 8 | Madaba | 1.4 |
| 9 | Amman | 1.4 |
| 10 | Tafilah | 1.4 |
| 11 | Aqaba | 1.4 |
| 12 | Maan | 1.4 |
Previous Daily Briefs
A new Jordan brief is written every day — each with its own risk map and downloadable CSV. Here's the last week; use the calendar to go further back.
📅 Browse every day by calendar →
Highlighted days have a brief. Tap a day for that day's map & analysis, or “csv” for that day's dataset ($5).