Situation Summary
New Zealand presents a composite threat score of 24, placing it outside the global top-risk tier. However, sub-national risk concentration in Canterbury (31.3) and Wellington (12.5) reflects significant localized activity over the past 72 hours, including police operations, civil statements, and infrastructure disruption. Event signal diversity—spanning public statements, government demands, police investigations, and conventional military references—suggests ongoing civil-administrative friction rather than systemic instability. The current trajectory indicates elevated but contained tension, with Canterbury requiring priority monitoring.
Key Developments
- Wellington waterfront (Southern and Eastern wards) – 8–9 June: State of emergency declared due to extreme swells; mandatory evacuations ordered for waterfront properties from Ōwhiro Bay through Breaker Bay. Coastal infrastructure and residential areas remain at elevated risk from ongoing weather events.
- Wellington Airport – Timing unclear from available intelligence, but recent social-media reports indicate airport fire with flight disruptions; operational status and casualty figures require confirmation.
- Canterbury region – 11–13 June: Multiple signal events, including police assassination, arrest/detain, and investigation activities. Signal density (9+ events in 72 hours) indicates elevated operational tempo; specific locations and parties require corroboration.
- Government-level activity – 12 June: Prime Minister rejection statement and government demand signals; context suggests administrative or policy dispute, though underlying issue remains partially obscured in available reporting.
- Multi-sector public statements – 11–13 June: Worker, farmer, actor, and firefighter disapproval statements indicate broad civil sentiment shift; sector-specific grievances may drive further localized action.
- Conventional military reference – 13 June: Magazine-attributed signal vs. New Zealand; geopolitical or defence-policy dimension requires clarification through deeper intelligence sweep.
Highest-Risk Areas
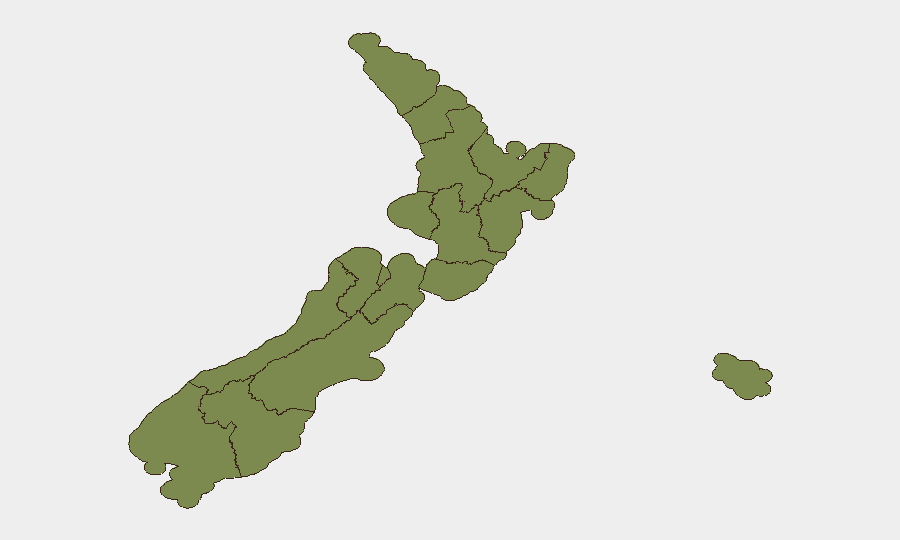
Canterbury dominates the risk profile with a composite score nearly 2.5× higher than Wellington. This concentration reflects police operations, possible civil conflict, and unresolved administrative tension. Wellington's secondary ranking (12.5) is driven by recent natural-hazard events (extreme swells, airport disruption) layered atop civil-sector statements. Bay of Plenty, Manawatū-Whanganui, and Otago present moderate background risk (7–10 range). Together, these five regions account for the majority of tracked threat events; northern and Chatham Island areas show minimal activity. Risk drivers appear to be civil-administrative (Canterbury) and natural-hazard/infrastructure (Wellington) rather than organized criminal or foreign-actor driven.
How GeoBit Would Assist
Intel Sweep and multi-language OSINT fusion would clarify the civilian grievances and government responses driving Canterbury signal density and the military-policy dimension of recent media references. AOI Monitoring & Early Warning set to Canterbury and Wellington would provide persistent tracking of police, government, and sector-actor statements, flagging escalation before it reaches wider civil unrest. GIS & Spatial Analysis combined with satellite imagery would track coastal hazard impact in Wellington and enable alternative-route planning for personnel or supply chains affected by airport disruption or evacuation zones.
7-Day Outlook
Signal intensity is expected to remain elevated in Canterbury and Wellington over the next 7 days as police investigations conclude and government responses are finalized. Natural hazard conditions in Wellington may persist, sustaining airport and coastal logistics disruption. Barring rapid escalation in civil confrontation or security-force deployment, overall threat trajectory should remain stable to slowly declining, though Canterbury warrants continuous re-assessment.
Highest-Risk Areas — Ranked
| # | State / Region | Risk |
|---|---|---|
| 1 | Canterbury | 31.3 |
| 2 | Wellington | 12.5 |
| 3 | Bay of Plenty | 10 |
| 4 | Manawatū-Whanganui | 7.9 |
| 5 | Otago | 7.9 |
| 6 | Taranaki | 7.4 |
| 7 | Auckland | 5.9 |
| 8 | Waikato | 5.9 |
| 9 | Northland | 1.8 |
| 10 | Chatham Islands | 1.3 |
| 11 | Hawke's Bay | 1.3 |
| 12 | Gisborne | 1.3 |
Sources
Previous Daily Briefs
A new New Zealand brief is written every day — each with its own risk map and downloadable CSV. Here's the last week; use the calendar to go further back.
📅 Browse every day by calendar →
Highlighted days have a brief. Tap a day for that day's map & analysis, or “csv” for that day's dataset ($5).