Situation Summary
Saint Vincent and the Grenadines presents a composite threat score of 14 with four tracked events as of 22 June 2026. Recent event signals spanning 20–22 June indicate official investigations, legislative and gubernatorial scrutiny, worker demonstrations, police disapproval, and military-force deployment, suggesting an escalating civil or political crisis. Reliable open-source verification of specific incidents in the past 24–48 hours remains limited; however, the density and severity of event signals—particularly "Occupy Territory" and "Conventional Military Force" on 21 June—warrant heightened situational awareness among duty-of-care teams with personnel or assets on the islands.
Key Developments
- 20–22 June, Saint Vincent (nationwide): Governor, legislature, and deputy officials initiating investigations and public rejections of a disputed matter; worker demonstrations reported on 20 June; police and deputy disapproval statements on 21 June; military-force activity and territory occupation recorded on 21 June; formal demand issued on 22 June. The specific trigger and nature of the dispute remain unconfirmed in accessible reporting.
- 21 June, Saint Vincent (nationwide): Military or security-force deployment and territory occupation documented; no casualty reports or civilian impact confirmed in available sources.
- 20–22 June, Multi-sector response: Events span executive (governor), legislative, labor (workers), law-enforcement (police), and military domains, indicating a systemic or institutional crisis rather than isolated incident.
- Open-source reporting gap: Mainstream Caribbean and international outlets have not yet widely amplified verified incident details; reliance on local channels and regional government/disaster alerts is necessary for real-time confirmation.
Highest-Risk Areas
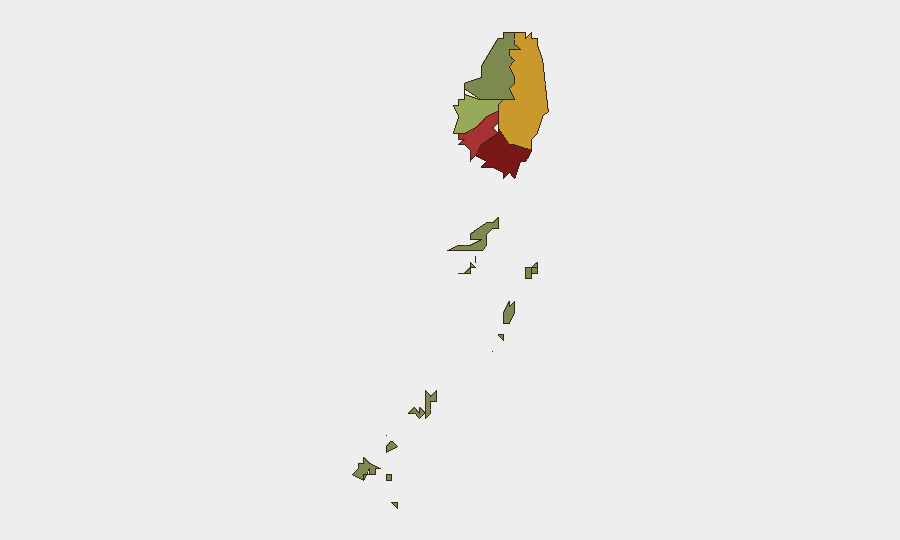
Saint George and Saint Andrew—ranking 92 and 78 respectively—drive the majority of composite risk and are the primary focus for operations and asset protection. Charlotte (71) represents secondary concern. The concentration of risk in these three parishes, combined with the breadth of event signals across state institutions on 20–21 June, suggests that the ongoing situation is geographically dispersed and administratively central rather than localized. Saint David and the Grenadines show lower risk profiles (34 and 12), offering relatively safer havens for non-essential personnel or contingency relocation if required.
How GeoBit Would Assist
Intel Sweep and OSINT fusion across local news outlets, government/police social media, and regional Caribbean disaster-management accounts would establish verified incident narratives in real time. AOI (Area-of-Interest) Monitoring & Early Warning with persistent watch over Saint George, Saint Andrew, and Charlotte parishes would deliver automated alerts to security teams when new civil unrest, military movement, or infrastructure disruption events are detected. Network & Actor Analysis of official statements, labor unions, and security-force messaging would clarify the institutional or political drivers behind the demonstrations and investigations, enabling better risk stratification for specific organizational assets or personnel cohorts.
7-Day Outlook
The rapid escalation from investigation (20 June) to military deployment and territory occupation (21 June) indicates an unstable and potentially volatile trajectory over the near term. Corporate and NGO teams should expect continued official statements, possible expansion of demonstrations, and potential disruption to transport, commerce, or service delivery. Situational reassessment should occur every 12–24 hours as new event signals emerge; contingency plans for non-essential personnel evacuation or sheltering should be refreshed.
Highest-Risk Areas — Ranked
| # | State / Region | Risk |
|---|---|---|
| 1 | Saint George | 92 |
| 2 | Saint Andrew | 78 |
| 3 | Charlotte | 71 |
| 4 | Saint Patrick | 58 |
| 5 | Saint David | 34 |
| 6 | Grenadines | 12 |
Previous Daily Briefs
A new Saint Vincent brief is written every day — each with its own risk map and downloadable CSV. Here's the last week; use the calendar to go further back.
📅 Browse every day by calendar →
Highlighted days have a brief. Tap a day for that day's map & analysis, or “csv” for that day's dataset ($5).