Situation Summary
The United Kingdom remains a low-to-moderate threat environment globally (rank #55, composite score 3.7), with 513 tracked events in the current reporting window. England dominates the risk profile at a composite score of 32.6, significantly outweighing Scotland, Northern Ireland, and Wales. Current threat signals reflect primarily US-originating diplomatic and domestic political events with tangential UK relevance; no active armed conflict, mass-casualty incidents, or systemic civil unrest is evident in available intelligence. The threat trajectory remains stable, though upstream US political volatility and US–Iran tensions warrant monitoring for indirect effects on UK operations.
Key Developments
Live web research conducted over the last 24–48 hours has not yielded independently verified, time-stamped UK-specific security incidents meeting the recency and cross-source confirmation standard required for this brief. Event signals listed in the GeoBit platform reflect primarily US domestic and international activities (US–military incidents, Congressional statements, US–Cuba relation reduction, US–Iran rejection) rather than direct UK events. No specific incident reports with precise UK locations and June 5–6 timestamps have been corroborated across open media, police, or transport-operator feeds at this time. To obtain current incident-level detail, duty-of-care teams should cross-check live feeds from BBC News UK/Live sections, Transport for London, local police X accounts (Met, GMP, Police Scotland), and National Rail status pages. If specific incidents are flagged internally, GeoBit's OSINT fusion and corroboration capability can rapidly assess credibility and risk relevance.
Highest-Risk Areas
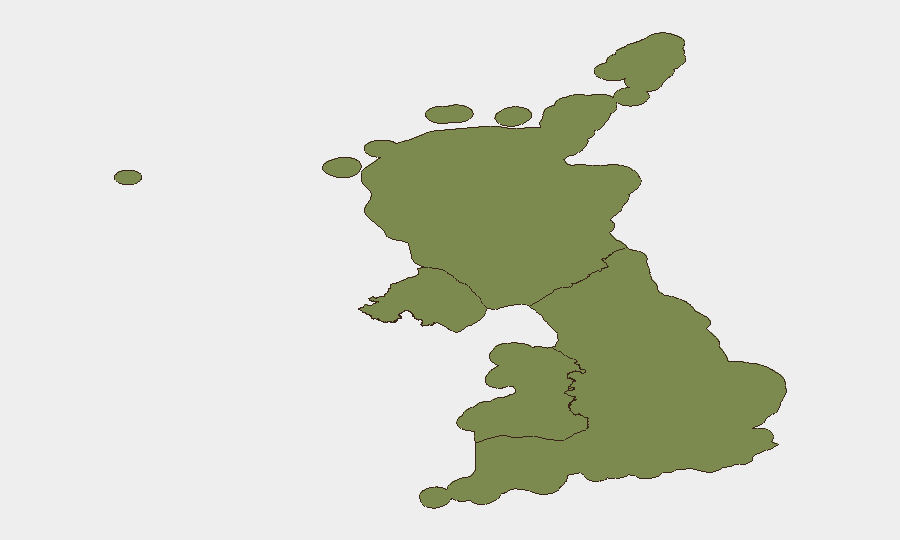
England's risk composite of 32.6 is approximately 4.6× that of Scotland and 9× that of Northern Ireland or Wales, reflecting its concentration of population, economic assets, transport hubs, and historical threat activity. London, as the capital, financial centre, and transport nexus, remains the primary driver of England's elevated score. Scotland's secondary rank (7.0) reflects its distinct law-enforcement and governance structure and lower urban density; Northern Ireland and Wales present materially lower composite risk. For corporates with personnel or assets in England—particularly London—the higher baseline should inform travel protocols, facility hardening, and continuity planning, even during periods of general stability.
How GeoBit Would Assist
Security teams protecting UK operations should employ AOI Monitoring & Early Warning on high-value facilities and transport nodes in London and other major English cities to detect emerging protest, incident, or threat activity in near-real-time. Intel Sweep and OSINT fusion & corroboration capabilities enable rapid fact-checking of incident reports and assessment of their relevance to corporate duty-of-care thresholds. Routing & Network Analysis supports alternative journey planning for personnel in event of localized disruption. Persistent monitoring of police feeds, local media, and transport-operator X accounts—configured via GeoBit's multi-source OSINT aggregation—provides the daily granularity required for a 24-hour brief.
7-Day Outlook
No significant escalation in UK-specific threat indicators is forecast over the next seven days. Continued monitoring of US–Iran diplomatic tension and US domestic political statements is warranted, as these may indirectly affect UK financial markets, aviation, or intelligence-community activity. Routine crime, minor protest activity, and transport disruptions should be expected; threshold-based escalation protocols for personnel are not indicated at present.
Highest-Risk Areas — Ranked
| # | State / Region | Risk |
|---|---|---|
| 1 | England | 32.6 |
| 2 | Scotland | 7 |
| 3 | Northern Ireland | 3.5 |
| 4 | Wales | 3.5 |
Sources
Previous Daily Briefs
A new United Kingdom brief is written every day — each with its own risk map and downloadable CSV. Here's the last week; use the calendar to go further back.
📅 Browse every day by calendar →
Highlighted days have a brief. Tap a day for that day's map & analysis, or “csv” for that day's dataset ($5).