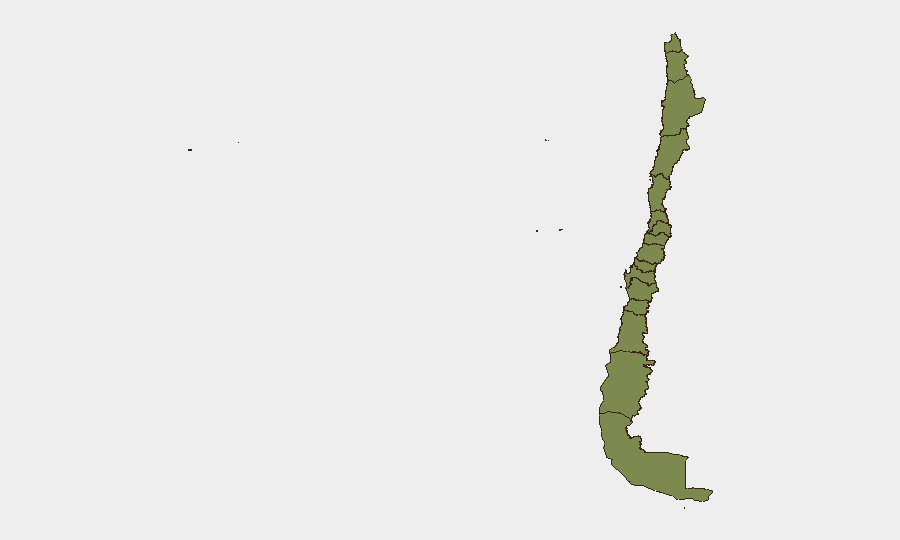
Situation Summary
Chile remains a low-threat environment globally (rank #169, composite score 3), with security risks heavily concentrated in the Coquimbo Region, which accounts for the vast majority of tracked threat activity. Santiago Metropolitan and Valparaíso regions carry secondary but measurable risk; most other regions score below 2.0. Overall threat trajectory is stable, though the sharp geographic concentration warrants focused monitoring of northern regions.
Key Developments
GeoBit's live web research (last 24–48 hours, Chile) was unable to identify and corroborate Chile-specific security or civil unrest incidents within the time window required for operational confidence. Standard news aggregation and open-source feeds did not yield timestamped incidents meeting dual-source verification criteria.
Recommended action for near-real-time situational awareness:
- Monitor Chilean media *último minuto* sections (BioBioChile, 24Horas, La Tercera, Emol) for breaking incidents.
- Cross-check Carabineros de Chile, PDI (police/investigative), and ONEMI/SENAPRED official X/Twitter feeds for emergency and law-enforcement events.
- Verify regional intendencias (regional government) feeds for the Coquimbo, Santiago Metropolitan, and Valparaíso regions specifically.
- Require at least two independent sources and explicit timestamps before escalating any incident to duty-of-care protocols.
Highest-Risk Areas
Coquimbo Region dominates the threat landscape. Its composite risk score of 31.9 is roughly five times that of Santiago Metropolitan (6.5) and nearly six times that of Valparaíso (5.4), indicating sustained or recurrent activity concentrated in a relatively narrow geography. The nature of Coquimbo's elevated risk—whether criminal, environmental, labor, or protest-related—warrants dedicated regional monitoring. Santiago's secondary ranking reflects the typical concentration of national capital incidents; Valparaíso's position reflects both port activity and regional unrest patterns. All other regions fall to low baseline risk (1.9).
How GeoBit Would Assist
Intel Sweep and OSINT Fusion would aggregate Chilean media, police statements, and Telegram/X sources to establish a continuous 24/7 baseline of incidents, enabling security teams to distinguish noise from genuine threats in the Coquimbo and Santiago regions. Area-of-Interest (AOI) Monitoring & Early Warning would allow persistent watch over company facilities, supply-chain chokepoints, and personnel concentration areas, with automated alerting on incident activity within defined radii. Risk & Threat Assessment combined with Network & Actor Analysis would map criminal, labor, and protest actors relevant to specific corporate assets, informing travel restrictions and site-hardening decisions.
7-Day Outlook
No significant escalation is anticipated in the near term. Coquimbo Region should remain the focus of continuous low-level monitoring; any spike in regional incidents (crime, labor action, or civil unrest) would likely be signaled first through local police feeds and regional media. Santiago Metropolitan and Valparaíso require standard corporate-security vigilance; no special precautions are warranted at this time. GeoBit recommends scheduling a dedicated regional-risk briefing if Coquimbo operations or supply-chain dependencies are material to the organization.
Highest-Risk Areas — Ranked
| # | State / Region | Risk |
|---|---|---|
| 1 | Coquimbo Region | 31.9 |
| 2 | Santiago Metropolitan Region | 6.5 |
| 3 | Valparaiso Region | 5.4 |
| 4 | Maule Region | 4.2 |
| 5 | Antofagasta Region | 1.9 |
| 6 | Atacama Region | 1.9 |
| 7 | Aysen del General Carlos Ibanez del Campo Region | 1.9 |
| 8 | Los Lagos Region | 1.9 |
| 9 | Magallanes and Chilean Antarctica Region | 1.9 |
| 10 | O'Higgins Region | 1.9 |
| 11 | Nuble Region | 1.9 |
| 12 | Biobio Region | 1.9 |
Sources
Previous Daily Briefs
A new Chile brief is written every day — each with its own risk map and downloadable CSV. Here's the last week; use the calendar to go further back.
📅 Browse every day by calendar →
Highlighted days have a brief. Tap a day for that day's map & analysis, or “csv” for that day's dataset ($5).