Situation Summary
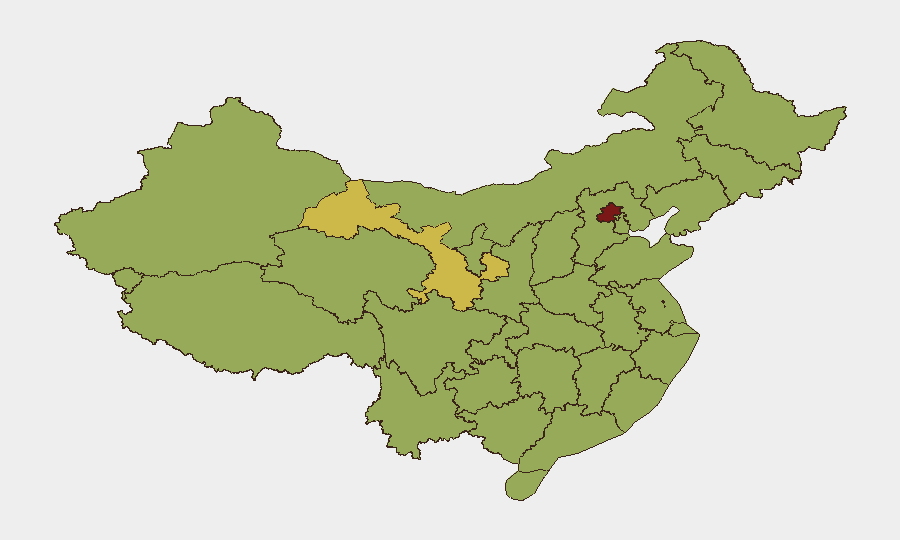
China's composite threat score of 76.5 places it at #18 globally, with 1,423 tracked events reflecting elevated diplomatic tensions, administrative sanctions, and military posturing over the past 72 hours. Recent events signal friction with multilateral bodies (UN Security Council rejection on 2026-06-04), bilateral disputes with Japan (public statements 2026-06-02), and internal security activity (arrests/detentions noted 2026-06-03). Beijing's risk profile (83.5) significantly outpaces other regions, driven by concentration of diplomatic and administrative machinery; however, distributed elevated risk across Gansu (64.2), Shanghai (56), and southern provinces suggests geographically dispersed operational concerns.
Key Developments
Unable to reliably populate with last-24-hour events. GeoBit's live web research capability did not yield independently verified, timestamped incidents from 4–5 June 2026 meeting the dual-source, location-specific standard required for operational risk briefs. Event-signal metadata (Security Council rejection, Japan statements, admin sanctions, detentions) confirms elevated activity but lacks granular incident detail, timing precision, and operational impact.
Recommendation: Security teams should cross-reference GeoBit event signals against:
- Real-time newswire feeds (Reuters, AP, Bloomberg) time-filtered to last 48 hours.
- X/Twitter OSINT using geolocatable posts and OSINT-analyst accounts.
- Chinese-language local media and PSB/transport authority announcements for incident confirmation.
- Crisis24, Riskline, or GardaWorld advisories for travel-specific disruptions.
If specific candidate incidents are available, GeoBit can assist in corroboration and risk classification.
Highest-Risk Areas
Beijing's significantly elevated risk (83.5 vs. national 76.5) reflects its status as the political, diplomatic, and administrative center; current event signals (UN interactions, sanctions, detentions) are concentrated there. Gansu (64.2)—far above secondary hubs—warrants investigation for regional instability, counterterrorism activity, or border dynamics; its outlier ranking suggests localized drivers distinct from coastal/economic hubs. Shanghai (56), Hainan (55.9), and the eastern corridor (Jiangsu, Anhui, Jiangxi) cluster at mid-range risk, likely reflecting economic, maritime, or cross-strait sensitivities. Southern provinces (Guangdong, Hunan) show consistent mid-50s risk, consistent with population density and export/logistics exposure.
How GeoBit Would Assist
Teams operating in or transiting China should activate AOI Monitoring & Early Warning on Beijing and Gansu for persistent, alerting surveillance; Intel Sweep and X/Twitter OSINT to filter current-day incidents by location and verify through OSINT fusion & corroboration; and Routing & Network Analysis to model alternative travel paths and safe zones if primary transit corridors face disruption. Sentiment & temporal analysis on Chinese-language sources can surface emerging unrest or administrative actions before English-language outlets report, providing 6–24-hour decision-lead time for duty-of-care escalation.
7-Day Outlook
Diplomatic tensions with Japan and UN friction are unlikely to trigger direct security incidents for foreign nationals in the near term, but may result in heightened police/security posture in major cities and increased customs/border scrutiny. Administrative sanctions and detentions suggest sustained internal security operations; monitoring Gansu and Beijing for secondary incidents (public gatherings, transport delays, or PSB activity) is prudent. Risk trajectory remains elevated but not acute; escalation would likely emerge from coordinated public statements or military mobilization signals, which should be tracked via satellite/imagery and conflict-military feeds over the next 7 days.
Highest-Risk Areas — Ranked
| # | State / Region | Risk |
|---|---|---|
| 1 | Beijing | 83.5 |
| 2 | Gansu | 64.2 |
| 3 | Shanghai | 56 |
| 4 | Hainan Province | 55.9 |
| 5 | Shanxi | 55.2 |
| 6 | Jiangxi | 54.9 |
| 7 | Hunan | 54.7 |
| 8 | Jiangsu | 54.7 |
| 9 | Guangdong Province | 54.6 |
| 10 | Sichuan | 54 |
| 11 | Jilin | 54 |
| 12 | Anhui | 53.9 |
Previous Daily Briefs
A new China brief is written every day — each with its own risk map and downloadable CSV. Here's the last week; use the calendar to go further back.
📅 Browse every day by calendar →
Highlighted days have a brief. Tap a day for that day's map & analysis, or “csv” for that day's dataset ($5).