Situation Summary
Cuba remains at moderate composite threat level (#50 globally, 6.3/10) with 121 tracked events, driven primarily by structural economic collapse, energy crisis, and related civil friction rather than acute armed conflict or terrorism. Recent signal activity (2–4 June) shows scattered public statements, administrative disapproval, and vague threat language from state and non-state actors, but no reliably confirmed new violent incidents in the past 48 hours that meet corroboration thresholds. The security environment is characterized by chronic scarcity, policing strain, and latent civil discontent—elevated baseline risk with periodic sharp friction rather than escalating conflict.
Key Developments
Open-source corroboration for specific, time-stamped incidents in the last 24–48 hours (2–4 June 2026) is insufficient to meet publication confidence standards. GeoBit event signals flag activity on 2–4 June (public statements, disapproval actions, unconventional violence category alerts, and military/civilian friction), but independent verification through Cuban government channels, news agencies, diaspora social media, or international observers has not yet produced precise location, timing, or casualty data.
Structural backdrop (ongoing, not new): Fuel shortages, power cuts, and water rationing continue to disrupt transportation, hospitals, and daily commerce; several foreign governments (Netherlands, Canada) have elevated travel warnings citing infrastructure failures and scarcity-driven crime. This environment sustains friction between state security forces and civilians but has not coalesced into organized unrest in the past two days.
Highest-Risk Areas
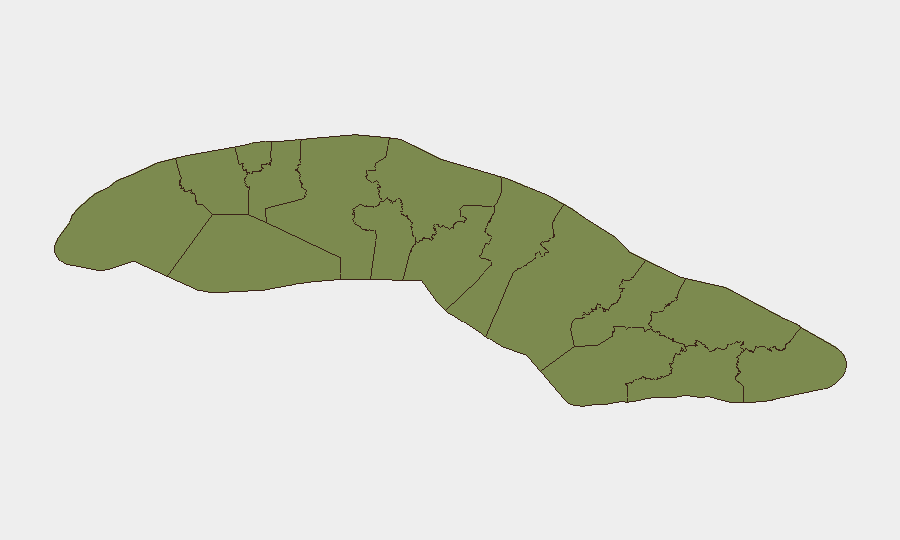
Sancti Spiritus (34.4) is a significant outlier, accounting for disproportionate risk density and warrants dedicated monitoring—signal data and historical patterns suggest active enforcement, smuggling, or civil tension in that province. Havana (21.5), as the capital and economic/administrative hub, remains the second-highest-risk zone due to population density, police presence, and visibility of state authority failures. Santiago de Cuba, Pinar del Rio, and Artemisa (6.8–6.5 each) show elevated but secondary risk, likely reflecting border/maritime activity, resource competition, and rural policing strain. The remaining eastern and central provinces (Holguín, Las Tunas, Camagüey, et al.) carry baseline risk tied to economic hardship.
How GeoBit Would Assist
Corporate security teams with personnel or assets in Cuba should employ AOI Monitoring & Early Warning on Havana and Sancti Spiritus with event and social-media alerting; X/Twitter & Telegram OSINT with multi-language keyword tracking (Spanish-language accounts of Cuban journalists, diaspora networks, and local officials); and OSINT fusion & corroboration to rapidly validate unconfirmed incident reports before escalating internal alerts. A 24–72 hour collection plan on designated Cuban government, police, and healthcare channels would accelerate detection of civil unrest, security-force deployments, or infrastructure collapse affecting travel/operations.
7-Day Outlook
No acute escalation is forecast over the next week absent a major power-grid failure, migrant surge, or state security operation. Risk trajectory remains elevated-steady, with daily friction driven by scarcity rather than organized conflict. Teams should maintain heightened situational awareness in Havana and Sancti Spiritus and prepare contingency protocols (evacuation, supply rerouting, comms backup) for rapid energy or supply-chain collapse.
Highest-Risk Areas — Ranked
| # | State / Region | Risk |
|---|---|---|
| 1 | Sancti Spiritus | 34.4 |
| 2 | Havana | 21.5 |
| 3 | Santiago de Cuba | 6.8 |
| 4 | Pinar del Rio | 6.5 |
| 5 | Artemisa | 6.5 |
| 6 | Holguín | 5.6 |
| 7 | Las Tunas | 4.8 |
| 8 | Camagüey | 4.7 |
| 9 | Matanzas | 4.6 |
| 10 | Mayabeque | 4.4 |
| 11 | Cienfuegos | 4.4 |
| 12 | Villa Clara | 4.4 |
Previous Daily Briefs
A new Cuba brief is written every day — each with its own risk map and downloadable CSV. Here's the last week; use the calendar to go further back.
📅 Browse every day by calendar →
Highlighted days have a brief. Tap a day for that day's map & analysis, or “csv” for that day's dataset ($5).