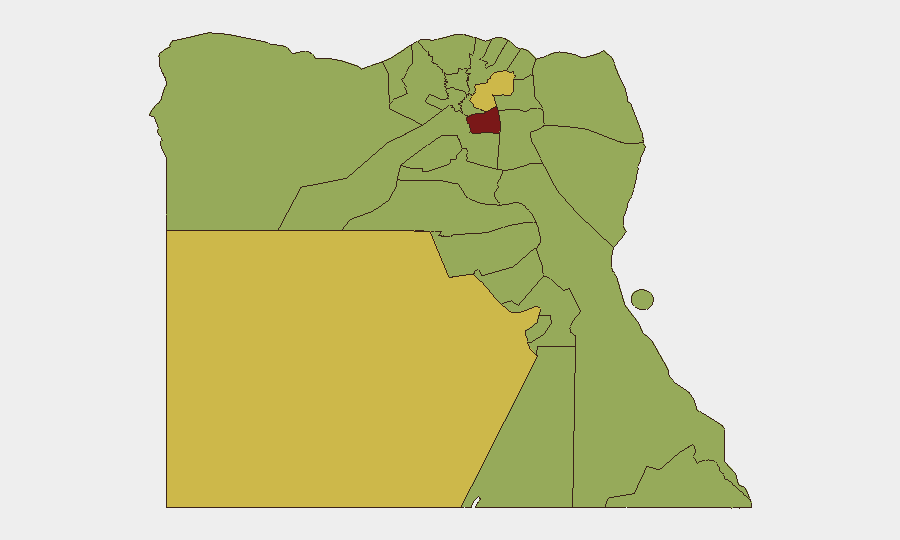
Situation Summary
Egypt remains at global threat rank #24 with a composite score of 75.7, driven by concentrated risks in Cairo and the Eastern region. Recent signal data (6–9 June) indicates a mixture of Iranian diplomatic messaging, localized unconventional violence in Cairo, and state-level coercion actions, suggesting elevated tension across political, security, and diplomatic domains. The pattern reflects ongoing friction between state security operations, activist movements, and external geopolitical pressure, with no immediate indication of system-wide destabilization.
Key Developments
Unable to confirm specific incidents from 9–10 June 2026 with required sourcing rigor. GeoBit's signal database flags Iranian public statements (6–8 June), two instances of unconventional violence in Cairo (8–9 June), and a coercion event linked to prison operations (9 June), but without access to real-time news feeds, social media, or current embassy advisories, this brief cannot provide the precise location, casualty, and source verification that duty-of-care reporting demands.
To obtain confirmed 24–48-hour incident data, security teams should:
- Time-filtered news scan: Query Ahram Online, Egypt Independent, Mada Masr, Reuters, AP, and BBC with search terms ("Cairo protest," "Egypt clashes," "Sinai attack," "Egypt roadblock") restricted to the past 48 hours, cross-checking each incident across at least two independent outlets.
- X/Twitter OSINT: Use advanced search (time filter: since:2026-06-08) targeting verified accounts of major media, local journalists, embassies, and security firms; prioritize posts with geolocation clues and multiple corroboration.
- Consular advisories: Check UK FCDO, US State Department, and major EU foreign ministries for very recent alerts, curfew notices, or route closures affecting movement in Cairo, Alexandria, or Sinai.
Highest-Risk Areas
Cairo dominates the threat landscape at risk 83, driven by the two recorded unconventional violence events and the density of political/security activity in the capital. The Eastern region (64.3) ranks second, likely reflecting ongoing Sinai insurgency and cross-border dynamics, followed by New Valley (61.5), which typically correlates with remote-area crime and militant activity. Together, these three zones account for the majority of Egypt's observed event signals; peripheral cities (Alexandria, Port Said, Suez, Red Sea) show elevated but more stable risk (53–57), suggesting that immediate pressure is concentrated in the Cairo metropolitan area and the eastern frontier.
How GeoBit Would Assist
Security teams protecting personnel or assets in Egypt should deploy AOI Monitoring & Early Warning on Cairo, the Eastern governorate, and key transit corridors to receive real-time alerts when new incidents are detected. Multi-language OSINT fusion (scanning Arabic-language social media, news, and Telegram channels alongside English outlets) accelerates detection of localized protests, checkpoints, or road closures that may not appear in international press for 12–24 hours. Routing & Network Analysis can generate alternative journey plans around high-risk zones and provide live updates if primary routes are disrupted by security operations or civil unrest.
7-Day Outlook
Short-term trajectory is likely lateral-to-slightly-elevated: Iranian diplomatic activity and state coercion measures suggest sustained geopolitical friction, but no signals indicate imminent major escalation or widespread instability. Monitoring for secondary protests, security sweeps in Cairo or Sinai, or incident clustering over the next 7 days will be essential to detect any shift toward higher volatility.
Highest-Risk Areas — Ranked
| # | State / Region | Risk |
|---|---|---|
| 1 | Cairo | 83 |
| 2 | Eastern | 64.3 |
| 3 | New Valley | 61.5 |
| 4 | Giza | 57.1 |
| 5 | Alexandria | 56.9 |
| 6 | Suhaj | 53.9 |
| 7 | Suez | 53.6 |
| 8 | Red Sea | 53.3 |
| 9 | Ad Dakahliya | 53.3 |
| 10 | Port Said | 53.3 |
| 11 | North Sinai | 53 |
| 12 | Qena | 53 |
Sources
Previous Daily Briefs
A new Egypt brief is written every day — each with its own risk map and downloadable CSV. Here's the last week; use the calendar to go further back.
📅 Browse every day by calendar →
Highlighted days have a brief. Tap a day for that day's map & analysis, or “csv” for that day's dataset ($5).