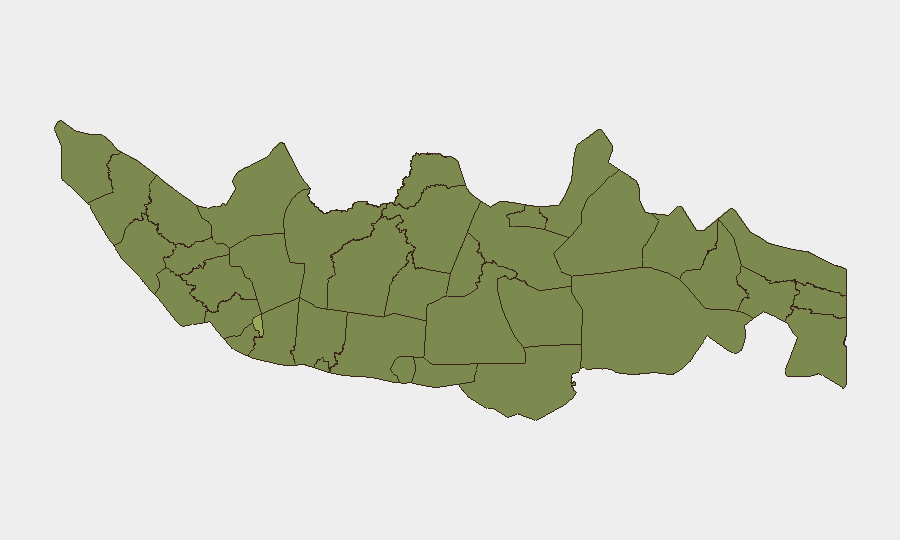
Situation Summary
Indonesia remains a mid-tier global security risk (rank #46, composite score 35.1) with 458 tracked threat events. Jakarta dominates the national risk profile at 54.6, more than 1.5× the country average, while East Java, West Java, and South Sulawesi form a secondary risk band. Recent signal activity (06-07 to 06-08) shows mixed event types—public statements, administrative sanctions, and isolated incidents—without clear escalation patterns, though the concentration of events on 06-07 warrants monitoring.
Key Developments
Live web research for the last 24–48 hours did not surface verified current security incidents, civil unrest, crime spikes, or travel advisories specific to Indonesia that meet incident-reporting criteria. Recent GeoBit platform signals (06-07 to 06-08) include:
- 06-07 · Surabaya (East Java): Investigation initiated; nature and parties unclear from current signal metadata.
- 06-07 · Jakarta: Multiple public statements from government and non-state actors; no corroborated escalation reported.
- 06-07 · Worker (national): Administrative sanctions applied; scope and sector not yet specified.
- 06-07 · Physical Assault (Jakarta): Attorney assaulted; context and outcome remain under assessment.
- 06-08 · Ministry of Finance (Jakarta): Public statement directed at United States; likely trade or diplomatic rhetoric without immediate operational impact.
Note: Headline verification and actor-motive clarification are pending. Corporate teams should request live news/X feeds if real-time incident depth is required.
Highest-Risk Areas
Jakarta's dominant risk score (54.6) reflects its status as Indonesia's political, financial, and administrative hub—concentrating government activity, large corporate presence, critical infrastructure, and protest/political expression. East Java (37.2) and West Java (35.3) together account for major industrial zones, ports, and manufacturing capacity; both regions show elevated civil unrest and labor-dispute signals. South Sulawesi (33.9) and Banten (30.9) round out the top five, with South Sulawesi linked to maritime crime and regional separatist sentiment, and Banten serving as Jakarta's urban exurb and logistics corridor. Risk in lower-ranked regions (Central Java, South Papua, Riau) remains above national baseline but is not currently acute.
How GeoBit Would Assist
Security teams with personnel or assets in Indonesia should deploy Area-of-Interest (AOI) Monitoring with alerting on Jakarta and East/West Java to track public statements, labor actions, and protest activity in real time. Intel Sweeps and multi-language OSINT fusion (including X/Twitter, Telegram, and local news) would provide 24-hour early warning of civil unrest, transport disruption, or targeted crime. Network & Actor Analysis applied to recent signal clusters would clarify motive and scale of the 06-07–06-08 incidents and flag secondary risk to supply chain or staff safety.
7-Day Outlook
No major escalation is signaled for the next week, but the concentration of statements and administrative/enforcement actions on 06-07 suggests possible policy shifts or labor disputes in progress. Continued monitoring of Jakarta and East Java is warranted; any uptick in physical-assault or protest signals should trigger duty-of-care reviews for field teams and logistics corridors. Regional stability remains fragile; external shocks (trade disputes, commodity-price swings) could amplify unrest in manufacturing zones.
Highest-Risk Areas — Ranked
| # | State / Region | Risk |
|---|---|---|
| 1 | Special capital Region of Jakarta | 54.6 |
| 2 | East Java | 37.2 |
| 3 | West Java | 35.3 |
| 4 | South Sulawesi | 33.9 |
| 5 | Banten | 30.9 |
| 6 | Central Java | 28.4 |
| 7 | South Papua | 27.9 |
| 8 | Riau | 26.2 |
| 9 | East Nusa Tenggara | 25.9 |
| 10 | Gorontalo | 25.4 |
| 11 | North Sumatra | 25.3 |
| 12 | West Kalimantan | 25.3 |
Sources
Previous Daily Briefs
A new Indonesia brief is written every day — each with its own risk map and downloadable CSV. Here's the last week; use the calendar to go further back.
📅 Browse every day by calendar →
Highlighted days have a brief. Tap a day for that day's map & analysis, or “csv” for that day's dataset ($5).