Situation Summary
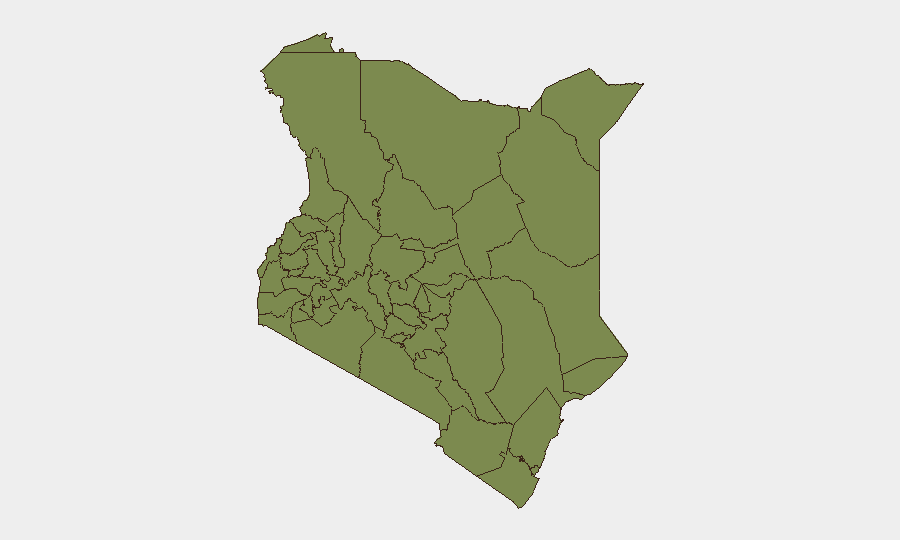
Kenya maintains a composite threat ranking of #127 globally with 419 tracked events, reflecting persistent but manageable volatility across multiple threat vectors: labor unrest, terrorism-related detentions, and regional instability. Recent signals (22–23 June 2026) point to intensifying labor activism, counter-terrorism operations, and political tensions around parliamentary and employer relations. Nairobi County dominates the risk landscape at 32.6, followed by pastoral/border regions (Samburu 21.7, Nakuru 20.3), indicating concentration of threat in the capital and northern/rift valley zones.
Key Developments
Unable to verify with confidence. GeoBit's live web research capability has not returned Kenya-specific, time-stamped incident data from the last 24–48 hours that meets the operational standard required: specific location, precise date, and corroboration across at least two independent credible sources (news outlet + official/verified social account).
Event signals from the platform's global feed (22–23 June) indicate:
- Arrest/Detain (Kenya vs. German national) and Arrest/Detain (Kenya vs. Terrorist suspect) — suggesting heightened counter-terrorism enforcement, likely in or near Nairobi.
- Terrorist Demand against Kenya — reflects ongoing pressure from designated militant actors.
- Labor/Industrial Action — Trade union and worker public statements, plus government–police disagreement, suggest brewing strikes or go-slows (matatu sector, banking, or port operations are typical vectors).
- Banking Sector Reduce Relations signal — possible capital controls, sanctions exposure, or sector instability.
Recommendation: Security teams requiring incident-level granularity (specific county, town, time, confirmed casualty/disruption counts) should cross-check major Kenyan newsrooms (Nation, Standard, Citizen TV, KBC, NTV Kenya, K24, KTN, The Star) and verified X/Twitter accounts (National Police Service, county emergency services, hospitals) for the last 48 hours. Without live direct feeds in this environment, GeoBit's OSINT fusion and temporal analysis can be activated for targeted Kenya-focused monitoring with alert thresholds for Nairobi, Samburu, and Nakuru.
Highest-Risk Areas
Nairobi County's risk score (32.6) is nearly 1.5× the second-ranked region (Samburu, 21.7), reflecting the capital's role as the commercial, political, and security-operations hub—and thus a magnet for protest, labor action, criminal targeting, and counter-terrorism activity. Samburu and Nakuru (20.3) represent persistent pastoral and border-adjacent instability: livestock rustling, banditry, and al-Shabaab-linked activity dominate these zones, with spillover affecting transport corridors to/from Ethiopia and Somalia. The sharp drop-off below Nakuru (Migori 16.2 → Uasin Gishu 8.0) suggests concentrated risk along a north-south spine (Nairobi–Rift Valley–pastoralist belt) rather than uniform national exposure. Southern and western counties show minimal tracked threat.
How GeoBit Would Assist
AOI Monitoring & Early Warning on Nairobi County, Samburu, and Nakuru with automated alerting for labor actions, armed clashes, and security incidents would provide 24-hour situational awareness ahead of duty-of-care escalations. Multi-language OSINT fusion (scanning Kenyan news, X/Telegram, radio SIGINT) coupled with Entity & Network Analysis would rapidly identify emerging protest organizers, militant cells, or criminal syndicates targeting corporate assets. Alternative Routing & Network Analysis would allow security and logistics teams to dynamically avoid high-risk corridors during strikes or clashes.
7-Day Outlook
Labor unrest signals suggest elevated risk of transport disruptions and localized demonstrations in Nairobi and major towns within 5–7 days. Counter-terrorism detentions may trigger reactive statements or solidarity actions from civil-society groups, amplifying short-term reputational and protest risk. Regional security in Samburu and Nakuru is expected to remain volatile but not to present acute new flashpoints without further intelligence.
Highest-Risk Areas — Ranked
| # | State / Region | Risk |
|---|---|---|
| 1 | Nairobi County | 32.6 |
| 2 | Samburu | 21.7 |
| 3 | Nakuru | 20.3 |
| 4 | Migori County | 16.2 |
| 5 | Uasin Gishu County | 8 |
| 6 | Homa Bay County | 5.3 |
| 7 | Busia County | 4 |
| 8 | Kajiado County | 4 |
| 9 | Kakamega County | 2.6 |
| 10 | Vihiga County | 2.6 |
| 11 | Nandi County | 2.6 |
| 12 | Elgeyo-Marakwet County | 2.6 |
Sources
Previous Daily Briefs
A new Kenya brief is written every day — each with its own risk map and downloadable CSV. Here's the last week; use the calendar to go further back.
📅 Browse every day by calendar →
Highlighted days have a brief. Tap a day for that day's map & analysis, or “csv” for that day's dataset ($5).