Situation Summary
Lithuania remains a low-threat environment globally (rank #115, composite score 2) with no verified security incidents, civil unrest, or infrastructure disruptions identified in the last 24–48 hours. Two agriculture-related event signals surfaced on 25–27 June (a Department of Agriculture investigation and a public statement from the Agriculture Ministry regarding Iran), though neither has been independently corroborated as a security or conflict risk. The country's overall stability trajectory remains stable, with Vilnius County carrying the highest sub-national risk profile.
Key Developments
- 2026-06-27 · Agriculture Ministry Public Statement (Lithuania-wide): Official statement issued regarding Iran; no verified security, diplomatic, or trade-disruption impact confirmed at this time.
- 2026-06-25 · Department of Agriculture Investigation (Lithuania-wide): Investigation initiated; scope and findings not yet publicly detailed; no public-safety or operational impact identified.
Note: Live web research for the last 24–48 hours has not surfaced independently verified security, conflict, crime, infrastructure, cyberattack, or travel-risk incidents in Lithuania. Event signals above reflect GeoBit's tracked event feeds but lack corroboration from multiple news or official sources. Corporate security teams are advised to monitor official Lithuanian government channels (Ministry of Interior, police, municipal authorities) and major news outlets for any emerging incidents before escalating response.
Highest-Risk Areas
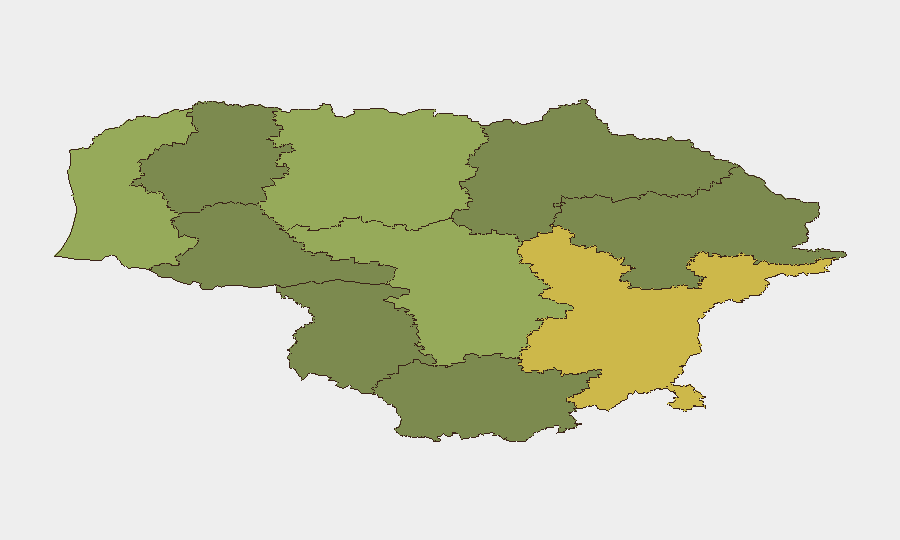
Vilnius County dominates sub-national risk (score 68), reflecting the capital's concentration of government, diplomatic, and commercial activity—typical for capital regions in NATO/EU member states. Kaunas (58) and Klaipėda (52) counties follow, likely driven by industrial activity, port operations, and regional economic hubs. Secondary risk is distributed across inland counties (Siauliai, Panevezys, Taurage) with scores in the 32–42 range, reflecting lower population density and typically lower operational exposure for most multinationals. Overall, risk is dispersed and moderate; no single county presents acute or escalating threat.
How GeoBit Would Assist
Intel Sweep & OSINT Fusion across Lithuanian news outlets, government social media, and X/Twitter enables rapid detection and cross-verification of emerging security incidents (protests, infrastructure failure, cyberattacks) within 1–2 hours of occurrence. Persistent AOI Monitoring & Early Warning on Vilnius County government districts, major transport hubs, and critical infrastructure can provide advance notice of unplanned disruptions or civil unrest. GIS & Spatial Analysis combined with Routing & Network Analysis allows security teams to identify alternative travel routes and supply-chain detours if specific counties or transport corridors become temporarily restricted. Use of Conflict & Military tracking and Election Monitoring capabilities (if relevant to political cycle) helps anticipate longer-term stability shifts.
7-Day Outlook
No imminent security escalation is forecast for Lithuania. The June agriculture-related signals should be monitored for wider policy or trade implications, particularly if they signal broader EU–Iran or domestic agricultural regulatory shifts. Routine monitoring of Vilnius County government channels and transport-hub social media remains prudent given the capital's concentration of operations and diplomatic presence; no elevated alert threshold is warranted at this time.
Highest-Risk Areas — Ranked
| # | State / Region | Risk |
|---|---|---|
| 1 | Vilnius County | 68 |
| 2 | Kaunas County | 58 |
| 3 | Klaipeda County | 52 |
| 4 | Siauliai County | 42 |
| 5 | Panevezys County | 38 |
| 6 | Taurage County | 35 |
| 7 | Utena County | 33 |
| 8 | Alytus County | 32 |
| 9 | Telsiai County | 28 |
| 10 | Marijampole County | 25 |
Previous Daily Briefs
A new Lithuania brief is written every day — each with its own risk map and downloadable CSV. Here's the last week; use the calendar to go further back.
📅 Browse every day by calendar →
Highlighted days have a brief. Tap a day for that day's map & analysis, or “csv” for that day's dataset ($5).