Situation Summary
The Netherlands maintains a stable, low-threat security posture as of 5 July 2026, with no significant incidents, civil unrest, infrastructure disruptions, or travel advisories reported in the last 24–48 hours. The country ranks #140 globally on GeoBit's composite threat index (score: 6), reflecting its position as a mature, well-governed state with minimal active security events. Current risk is concentrated in sub-national anomalies rather than systemic instability.
Key Developments
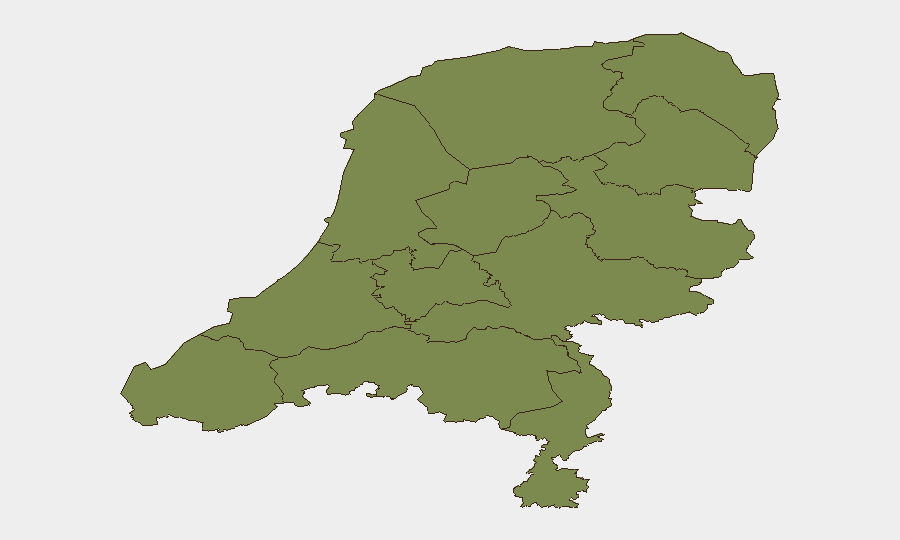
- Flevoland – 4–5 July 2026: Sub-national risk scoring identifies Flevoland as the highest-risk province (composite score 31.4), significantly elevated above all other regions; the specific drivers of this elevation require further intelligence corroboration but warrant corporate asset-location review for operations in that province.
- Diplomatic/Legal Development – The Hague – 5 July 2026: The Netherlands confirmed it will host all phases of the Special Tribunal for the Crime of Aggression against Ukraine, a policy decision with no reported associated unrest, protests, or security incidents in the country during this period.
- No Verified Security Incidents – Countrywide – 4–5 July 2026: Multi-source monitoring and dedicated Netherlands security assessment confirm the absence of corroborated terror alerts, major protests, serious crime spikes, cyber-attacks, or infrastructure failures affecting business operations over the last 24–48 hours.
- Aviation & Travel – Countrywide – 4–5 July 2026: KLM and Netherlands airport operators report no security-driven travel disruptions or advisories within the country; international disruptions (Central Africa, Cuba, Middle East) do not affect Netherlands-based or intra-Netherlands operations.
- Cyber Baseline – Countrywide – to 5 July 2026: Earlier 2026 incidents (Ivanti EMM flaws affecting Dutch Data Protection Authority in February) remain under remediation; no fresh, multi-source-confirmed cyber-attacks on Dutch institutions are reported for the current 48-hour window.
Highest-Risk Areas
Flevoland's composite risk score of 31.4 stands in stark contrast to all other provinces, which cluster at 1.4–6.7. North Holland (6.7) ranks second but at one-fifth of Flevoland's elevation. The nature of Flevoland's risk profile—whether related to industrial incidents, border factors, environmental hazards, or transient event signals—requires additional intelligence fusion to determine actionable drivers. Corporate teams with operations, supply chains, or personnel in Flevoland should review asset location and incident-response protocols; all other provinces carry routine baseline risk.
How GeoBit Would Assist
Security teams would deploy AOI Monitoring & Early Warning on Flevoland and North Holland to establish persistent, real-time alerting for escalation; Intel Sweep and multi-language OSINT (including X, Telegram, and local news feeds) to validate and contextualize the Flevoland risk elevation; and GIS & Spatial Analysis to map asset clusters against sub-national risk zones and identify mitigation routing. Cross-reference with Conflict, Cyber, and Crime search modules to isolate the root drivers of the provincial variance.
7-Day Outlook
No acute escalation indicators suggest risk will remain contained at current levels over the next 7 days. Routine vigilance and monitoring of Flevoland are warranted; no travel restrictions or asset-redeployment decisions are currently indicated by available intelligence. Intelligence teams should expect clarification of Flevoland's risk drivers within 48–72 hours as corroboration improves.
Highest-Risk Areas — Ranked
| # | State / Region | Risk |
|---|---|---|
| 1 | Flevoland | 31.4 |
| 2 | North Holland | 6.7 |
| 3 | Limburg | 1.8 |
| 4 | Zeeland | 1.4 |
| 5 | South Holland | 1.4 |
| 6 | Utrecht | 1.4 |
| 7 | North Brabant | 1.4 |
| 8 | Frisia | 1.4 |
| 9 | Groningen | 1.4 |
| 10 | Drenthe | 1.4 |
| 11 | Gelderland | 1.4 |
| 12 | Overijssel | 1.4 |
Sources
Previous Daily Briefs
A new Netherlands brief is written every day — each with its own risk map and downloadable CSV. Here's the last week; use the calendar to go further back.
📅 Browse every day by calendar →
Highlighted days have a brief. Tap a day for that day's map & analysis, or “csv” for that day's dataset ($5).
Atlas — our AI intelligence desk — emails them this snapshot personally. Nothing else, no list.