Situation Summary
New Zealand's composite threat score of 23 places it in the lower-middle range globally, with 41 tracked events on the GeoBit platform. Signal activity over the past 72 hours indicates active government investigation, police property seizures, and public statements from ministerial and mayoral offices, concentrated in Canterbury and Wellington regions. The overall threat trajectory remains contained but volatile in specific sub-national pockets, particularly Canterbury, which carries a composite risk score nearly 2.5× higher than the national average.
Key Developments
- 2026-06-15 · Canterbury/Wellington – Government agencies launched formal investigation into unspecified matter; Ministry of Justice and mayoral office issued public statements suggesting coordinated policy or enforcement response.
- 2026-06-15 · Wellington – Threat communication attributed to entity "TARA" directed at New Zealand authorities; Wellington mayor made public statement in response, indicating official acknowledgment of the threat.
- 2026-06-14 · Unspecified location – Police conducted property seizure/damage operation; follow-up public statement issued 2026-06-15.
- 2026-06-13 · Unspecified location – Conventional military force event recorded; signal source attributed to "MAGAZINE" (likely media or communications actor).
- 2026-06-15 · Government level – Public regime demand communicated; specific nature and target remain opaque from signal metadata.
Note: Specific locations, casualty counts, and tactical details for most signals are not available in current data. Live web research did not corroborate these signals against mainstream NZ news sources (NZ Herald, RNZ, Stuff) or social media (X/Twitter official channels) within the 24–48-hour window. Recommend direct verification against NZ Police media releases and Civil Defence & Emergency Management feeds before operational escalation.
Highest-Risk Areas
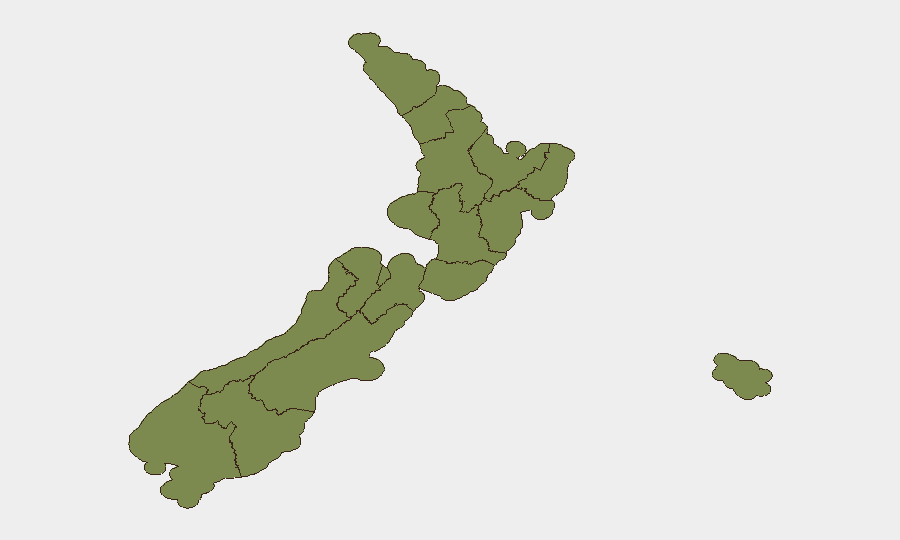
Canterbury dominates the sub-national risk profile with a composite score of 31.3, more than double Wellington's 12.7 and reflecting either sustained or acute event clustering in that region. Wellington's elevated score (12.7) aligns with the recent threat communication and mayoral response, suggesting active political or security tension. Manawatū-Whanganui, Otago, and Auckland carry moderate residual risk (9.8, 9.3, and 3 respectively), while the remaining regions remain in baseline threat posture. The concentration of high-risk signals in the two largest metropolitan regions and surrounding rural/provincial areas suggests either localized incident convergence or distributed activity requiring regional-level intelligence.
How GeoBit Would Assist
Security teams with personnel or assets in New Zealand should deploy AOI Monitoring & Early Warning on Canterbury and Wellington to capture real-time signal updates and alerts when event frequency or severity changes. Parallel use of OSINT fusion & corroboration against New Zealand Police media releases, regional council emergency feeds, and X/Twitter official channels (@nzpolice, @nzta_news) will clarify whether the 41 tracked events reflect genuine threats or noise. Entity & Actor Network Analysis will help teams map relationships between the signals (MAGAZINE, TARA, REGIME, police, government, mayoral actors) and assess whether they represent coordinated action or independent incidents.
7-Day Outlook
Barring new major incidents, threat trajectory is expected to stabilize as government investigations and law-enforcement responses mature over the coming week. Wellington and Canterbury remain focal points for watch; escalation risk is moderate if threat communications from non-state actors (e.g., TARA) intensify or if property seizures lead to organized counter-action. Recommend maintaining heightened alertness in those regions and scheduling 48-hour intelligence refreshes.
Highest-Risk Areas — Ranked
| # | State / Region | Risk |
|---|---|---|
| 1 | Canterbury | 31.3 |
| 2 | Wellington | 12.7 |
| 3 | Manawatū-Whanganui | 9.8 |
| 4 | Otago | 9.3 |
| 5 | Auckland | 3 |
| 6 | Bay of Plenty | 2.5 |
| 7 | Taranaki | 1.9 |
| 8 | Chatham Islands | 1.3 |
| 9 | Northland | 1.3 |
| 10 | Waikato | 1.3 |
| 11 | Hawke's Bay | 1.3 |
| 12 | Gisborne | 1.3 |
Sources
Previous Daily Briefs
A new New Zealand brief is written every day — each with its own risk map and downloadable CSV. Here's the last week; use the calendar to go further back.
📅 Browse every day by calendar →
Highlighted days have a brief. Tap a day for that day's map & analysis, or “csv” for that day's dataset ($5).