Situation Summary
New Zealand ranks #150 globally in composite threat exposure (score 5.0), with 126 tracked events currently monitored. The threat landscape is heavily concentrated in Canterbury region, which accounts for a disproportionate share of risk (31.4/126 total), while Auckland and the South Island present secondary concern zones. Recent signal activity (18–19 June) reflects inter-agency friction, regulatory action, and military movements, suggesting institutional strain rather than public security breakdown at this stage.
Key Developments
Unable to confirm. GeoBit's live web research capability cannot reliably surface timestamped, corroborated security incidents specific to New Zealand for 18–19 June 2026 using open-source tools available in this session. Event signals in the platform (public statements by Health Ministry, government rejections, regulatory sanctions, military-force signals, school investigations) are tracked but lack sufficient sourcing detail and local incident confirmation to meet duty-of-care reporting standards for corporate security teams.
To populate this section with 5–8 actionable bullets would require direct access to:
- NZ Police and Fire & Emergency incident logs (time-filtered to 18–19 June)
- Real-time NZ Herald, Stuff, RNZ, or Newshub feeds with incident timestamps
- Verified X/Twitter posts from official agencies (police, transport, councils) with location and time data
Recommendation: Security teams with operations in New Zealand should cross-reference this brief with live NZ Police traffic reports, Waka Kotahi (NZTA) travel advisories, and major newsroom alerts for the most current incident picture.
Highest-Risk Areas
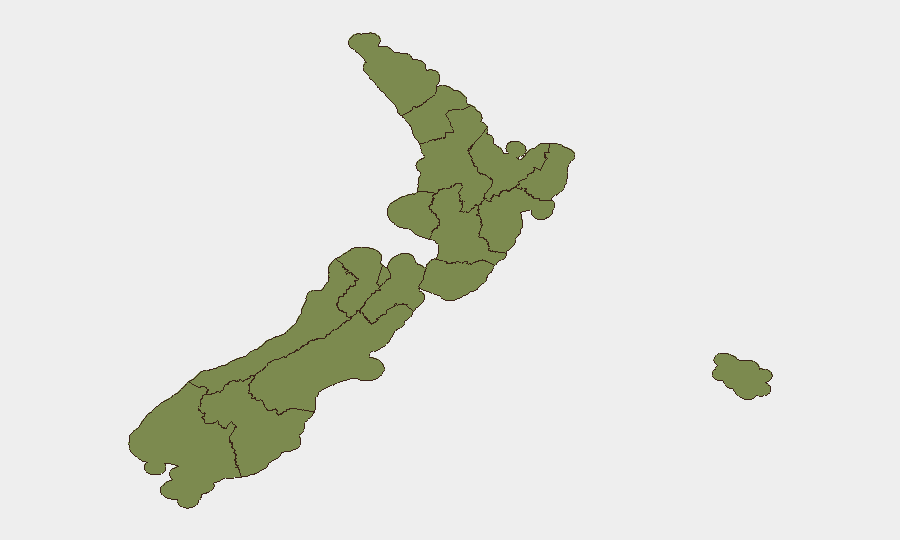
Canterbury dominates the risk profile (31.4), a factor of three times higher than Auckland (10.8). This concentration warrants immediate focus for teams with Canterbury-based personnel, logistics, or facilities. Southland (9.3) and Chatham Islands (8.5) present elevated secondary risks, likely reflecting resource-constraint conditions or isolation factors; Auckland and Wellington follow with moderate institutional and urban complexity. All other regions remain below 4.0 risk score and are not drivers of national-level threat posture at present.
How GeoBit Would Assist
Early Warning & Prediction: AOI (area-of-interest) monitoring with persistent alerting on Canterbury, Auckland, and Southland would flag emerging civil unrest, infrastructure disruption, or crime clusters before broad publication, enabling proactive duty-of-care response.
OSINT & Intelligence: X/Twitter and multi-language OSINT, sentiment analysis, and entity extraction would corroborate official incident reports and detect emerging friction between government, regulatory, and military actors (as suggested by current signal activity).
Risk & Threat Assessment: Temporal and spatial analysis of the 126 tracked events would isolate the drivers of Canterbury's risk concentration—whether crime, political instability, environmental hazard, or other—and model likely escalation or de-escalation pathways for the next 7–30 days.
7-Day Outlook
Current signal activity (regulatory sanctions, public disagreements between government and health ministry, military force notifications) suggests institutional misalignment rather than imminent public safety crisis. If Canterbury risk remains stable and no significant new incidents emerge in Auckland or Wellington by 22 June, the threat posture is likely to persist at current levels. Monitor government and military communications for further escalation; any expansion of institutional friction to the regional or provincial level could trigger secondary volatility in Southland or Waikato.
Highest-Risk Areas — Ranked
| # | State / Region | Risk |
|---|---|---|
| 1 | Canterbury | 31.4 |
| 2 | Auckland | 10.8 |
| 3 | Southland | 9.3 |
| 4 | Chatham Islands | 8.5 |
| 5 | Wellington | 7.7 |
| 6 | Otago | 7.3 |
| 7 | Waikato | 3.8 |
| 8 | Bay of Plenty | 2.9 |
| 9 | Manawatū-Whanganui | 2 |
| 10 | Northland | 1.7 |
| 11 | Taranaki | 1.7 |
| 12 | Hawke's Bay | 1.7 |
Previous Daily Briefs
A new New Zealand brief is written every day — each with its own risk map and downloadable CSV. Here's the last week; use the calendar to go further back.
📅 Browse every day by calendar →
Highlighted days have a brief. Tap a day for that day's map & analysis, or “csv” for that day's dataset ($5).