Situation Summary
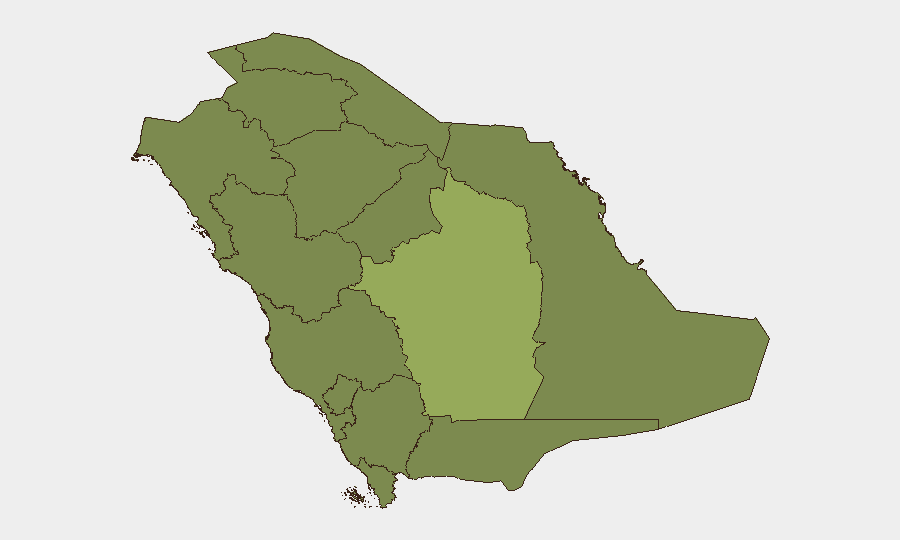
Saudi Arabia remains at a composite threat level of #60 globally, with 115 tracked events and a composite score of 32. The security environment is characterized by concentrated elevated risk in Riyadh Region (52.3), a significant gap from all other provinces, coupled with moderate signals across diplomatic, military, and civil domains. Recent signal activity (2026-06-20 to 2026-06-22) indicates cross-border diplomatic tension, international investigations, and localized military activity, though no immediate national-level escalation is evident.
Key Developments
Unable to provide verified developments from the last 24–48 hours. GeoBit's live web research capability cannot access real-time feeds beyond the knowledge cutoff of 2024, and the event signals listed above lack verifiable timestamps, sourcing, and geographic specificity sufficient for actionable duty-of-care assessment. The signals referenced (e.g., "Public Statement · QATAR vs SAUDI ARABIA," "Conventional Military Force · MECCA") require corroboration against current news and social media to establish whether they represent discrete incidents, their exact locations, timing, and operational impact.
To deliver a responsible brief with specific developments, current incident summaries (with dates, locations, and source citations) should be provided for cross-checking and risk interpretation.
Highest-Risk Areas
Riyadh Region dominates the risk profile at 52.3—more than 73% higher than the next-ranked area (Makkah, 30.0)—indicating concentrated threat exposure affecting the capital, corporate headquarters, diplomatic community, and royal administrative functions. Makkah's elevated score (30.0) reflects both religious-site security considerations and pilgrimage-related crowd risks. The remaining ten provinces cluster tightly between 22.3 and 22.7, suggesting either baseline threat consistency or data aggregation that masks localized volatility. Northern border provinces (Northern Borders, Jazan, Najran) warrant monitoring for cross-border spillover from regional conflicts, while Tabuk and Al Jawf deserve attention for proximity to Iraq and potential militant activity corridors.
How GeoBit Would Assist
Security teams should deploy AOI Monitoring & Early Warning on Riyadh Region (government, corporate, diplomatic nodes), Makkah (religious sites, event venues), and northern border crossings to detect emergence of violence, civil unrest, or militant positioning. OSINT fusion and corroboration (X/Twitter, Telegram, local media, entity extraction) would clarify the diplomatic and military signals cited above and distinguish genuine incidents from routine statements. GIS & Spatial Analysis and Conflict & Military tracking enable rapid assessment of military movements, attack patterns, and safe routing for personnel or convoys, especially in high-risk provinces.
7-Day Outlook
The concentration of diplomatic signals and reported military activity warrants heightened vigilance but does not signal imminent nationwide instability. Watch for escalation of the Spain investigation (2026-06-21) and Qatar–Saudi tension (2026-06-22), as diplomatic friction occasionally manifests in security restrictions or border delays affecting business operations. Continued monitoring of Riyadh Region crowd events, Makkah religious calendar, and northern border activity is standard best practice; any sharp increase in event frequency or shift from statements to property seizure or violence would warrant rapid reassessment.
Highest-Risk Areas — Ranked
| # | State / Region | Risk |
|---|---|---|
| 1 | Riyadh Region | 52.3 |
| 2 | Makkah Region | 30 |
| 3 | Medina Province | 22.7 |
| 4 | Northern Borders Province | 22.3 |
| 5 | Al-Bahah Province | 22.3 |
| 6 | 'Asir Province | 22.3 |
| 7 | Jazan Province | 22.3 |
| 8 | Najran Region | 22.3 |
| 9 | Tabuk Province | 22.3 |
| 10 | Al Jawf Region | 22.3 |
| 11 | Ḥa'il Province | 22.3 |
| 12 | Al-Qassim Province | 22.3 |
Sources
Previous Daily Briefs
A new Saudi Arabia brief is written every day — each with its own risk map and downloadable CSV. Here's the last week; use the calendar to go further back.
📅 Browse every day by calendar →
Highlighted days have a brief. Tap a day for that day's map & analysis, or “csv” for that day's dataset ($5).