Situation Summary
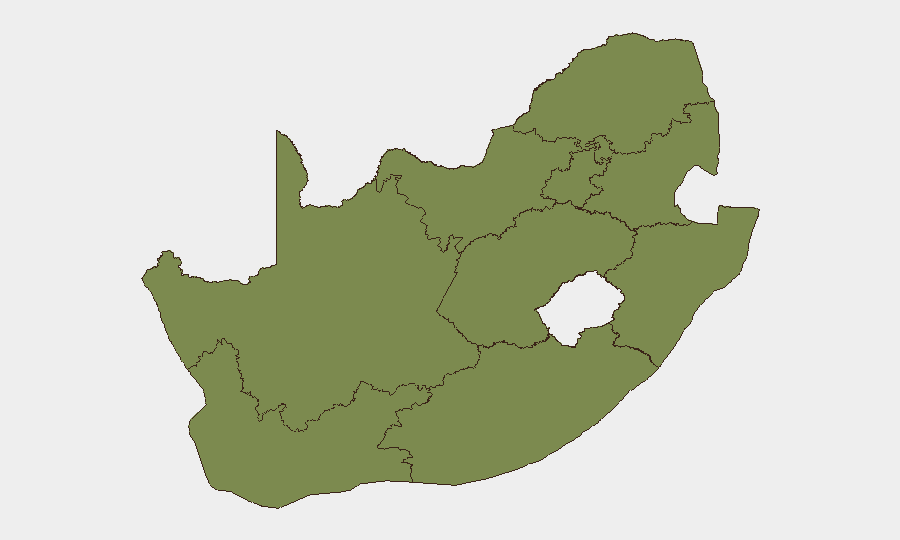
South Africa remains a moderate-risk environment (global rank #98) with Gauteng province dominating the threat landscape at a composite risk score nearly 4× higher than any other region. Over the past 48 hours, immigration enforcement operations in Durban and ongoing xenophobia-related tensions involving Nigerian nationals have added localized pressure, particularly in KwaZulu-Natal. Cyber threat intensity remains persistently elevated, with South African organizations absorbing an average of 1,738 attacks per week. The overall trajectory reflects sustained but non-critical volatility, concentrated in major urban metros and vulnerable migrant communities.
Key Developments
- Durban, KwaZulu-Natal – 11–12 June 2026: Durban Metro Police arrested 77 alleged illegal immigrants across multiple city areas during intensive 48-hour enforcement operations, including morning security checkpoints on key routes. Documentation and foreign-national status were primary enforcement triggers.
- Durban, KwaZulu-Natal – 11–12 June 2026: Road checkpoints established on major routes into and around Durban as part of the same operation, with vehicle stops and document verification creating potential friction points and transit delays for travelers and commuters.
- National (South Africa) – recent 48h window: South Africa's Department of Home Affairs processed 586 Nigerian nationals for repatriation after discovery of undocumented residence, reflecting ongoing immigration compliance action with cross-border diplomatic sensitivity.
- National (South Africa) – recent days: Nigerian sources reported allegations of 48-hour relocation demands on Nigerian nationals in some South African communities, citing criticism from Nigerian authorities over insufficient response to attacks on foreigners; claims lack consistent official confirmation but signal xenophobia-linked community tension.
- National (South Africa) – May–early June 2026 context: Check Point Research data confirms South African organizations face 1,738 cyberattacks per week on average, with government, telecoms, and education sectors most frequently targeted—an ongoing risk persisting into the current period.
Highest-Risk Areas
Gauteng province (risk 32.9) accounts for nearly two-thirds of South Africa's tracked threat events and dominates the composite risk environment; this reflects Johannesburg and Pretoria's status as economic and administrative hubs, attracting organized crime, financial fraud, and cyber activity. Free State (9.3) and Western Cape (5.3) follow at substantial distance, suggesting that threat concentration is heavily Gauteng-driven rather than evenly distributed. KwaZulu-Natal's current rank (#4, risk 3.7) is partially masked by the sub-national scoring, but the Durban immigration enforcement activity and xenophobia signals indicate emerging localized friction. Corporate and diplomatic presence in Gauteng requires the highest vigilance; secondary hubs (Cape Town, Durban) warrant monitoring for community and labor-related volatility.
How GeoBit Would Assist
Intel Sweep and OSINT fusion across local media, government sources, and social platforms would provide early detection of immigration enforcement trends, xenophobia escalation, and police operations affecting transit and business. AOI Monitoring & Early Warning on Gauteng commercial corridors, Durban checkpoints, and other high-risk zones would allow persistent surveillance and alerting on emerging incidents before they impact supply chains or personnel. Cyber risk assessment and threat tracking would contextualize the 1,738-attacks-per-week baseline and flag sector-specific or asset-specific vulnerabilities affecting corporate networks and critical infrastructure.
7-Day Outlook
Immigration enforcement operations are likely to continue in Durban and other metros, potentially creating localized transit friction. Xenophobia-related tensions may remain episodic and community-level rather than escalating to organized violence, but sentiment monitoring is warranted. Cyber threat density will remain elevated; no near-term de-escalation is expected.
Highest-Risk Areas — Ranked
| # | State / Region | Risk |
|---|---|---|
| 1 | Gauteng | 32.9 |
| 2 | Free State | 9.3 |
| 3 | Western Cape | 5.3 |
| 4 | KwaZulu-Natal | 3.7 |
| 5 | Eastern Cape | 3.5 |
| 6 | Limpopo | 3.2 |
| 7 | Mpumalanga | 3.2 |
| 8 | North West | 3.1 |
| 9 | Northern Cape | 2.9 |
Previous Daily Briefs
A new South Africa brief is written every day — each with its own risk map and downloadable CSV. Here's the last week; use the calendar to go further back.
📅 Browse every day by calendar →
Highlighted days have a brief. Tap a day for that day's map & analysis, or “csv” for that day's dataset ($5).