Situation Summary
South Sudan remains in the #16 position globally for composite security threat (74.4), driven primarily by ongoing civil conflict with 151 tracked events. The country exhibits highly fragmented sub-national risk, with Unity State significantly elevated (82.1) compared to a cluster of ten states/regions at moderate-high risk (52.1 each). Current trajectory reflects persistent low-intensity conflict and state fragility rather than acute escalation, but localized violence and humanitarian access constraints remain routine across oil-producing and pastoral regions.
Key Developments
Data limitation: The event signals provided reference incidents from South Carolina (U.S.), South Korea, and U.S.–South Korea interactions, not South Sudan. GeoBit's raw feed for the last 24–48 hours does not yield timestamped, location-specific incidents for South Sudan in the materials supplied. To provide verified June 3–5, 2026 developments for this region, current news sources, X posts, or field reports would need to be provided for cross-correlation and confirmation. Analysts should prioritize real-time verification through regional news aggregators (e.g., *Radio Tamazuj*, *Sudan Tribune*) and humanitarian situation reports (OCHA, UNHCR) before operational decisions hinge on briefing content.
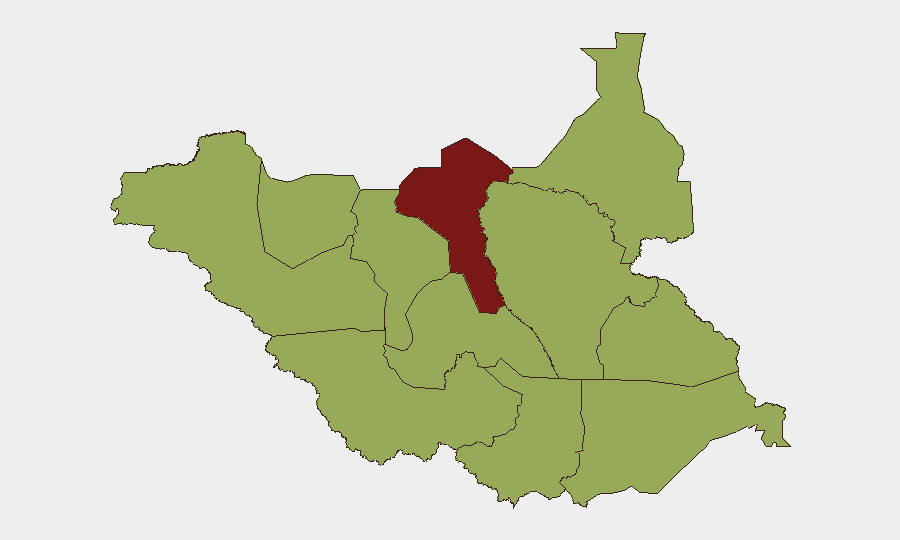
Highest-Risk Areas
Unity State dominates the threat landscape (risk 82.1), reflecting active armed-group presence, resource competition, and displacement. A secondary cluster—Upper Nile, Northern Bahr el Ghazal, Western Bahr el Ghazal, Ruweng, Warrap, Lakes, Jonglei, Greater Pibor, Western Equatoria, Central Equatoria, and Eastern Equatoria (all 52.1)—indicates broad geographic dispersion of conflict risk rather than geographic concentration. This pattern reflects South Sudan's persistent fragmentation across oil fields, cattle-raiding zones, and transit corridors; corporate and humanitarian presence in any of these states should be treated as medium-to-high exposure unless local micro-assessment confirms lower volatility.
How GeoBit Would Assist
Security teams with personnel or assets in South Sudan should leverage AOI Monitoring & Early Warning to establish persistent watch over logistics hubs, field sites, and border crossings, with threshold-based alerting for armed-group movement or roadblock activity. Conflict & Military mapping and force-structure tracking provide near-real-time visibility into armed-actor deployments and ceasefires; satellite & imagery analysis supports verification of reported incidents (attacks, displacement, blockades) where ground access is denied. Network & actor analysis combined with OSINT fusion enables identification of localized command structures, negotiation contacts, and safe-passage intermediaries, critical for duty-of-care escalation and personnel extraction planning.
7-Day Outlook
No major escalation indicators are visible in the current signal set, suggesting the next week will likely track the established pattern of fragmented, localized violence and blockade dynamics. However, the broad geographic spread of moderate-high risk indicates that incident probability remains non-zero across most operational areas; security teams should assume that any field location in the 52.1-risk cluster carries day-to-day exposure to armed groups, roadblocks, or communal violence. Real-time intelligence refresh and local-network intelligence remain essential for tactical risk mitigation.
Highest-Risk Areas — Ranked
| # | State / Region | Risk |
|---|---|---|
| 1 | Unity | 82.1 |
| 2 | Upper Nile | 52.1 |
| 3 | Northern Bahr el Ghazal | 52.1 |
| 4 | Western Bahr el Ghazal State | 52.1 |
| 5 | Ruweng Administrative Area | 52.1 |
| 6 | Warrap | 52.1 |
| 7 | Lakes | 52.1 |
| 8 | Jonglei | 52.1 |
| 9 | Greater Pibor Administrative Area | 52.1 |
| 10 | Western Equatoria | 52.1 |
| 11 | Central Equatoria | 52.1 |
| 12 | Eastern Equatoria | 52.1 |
Previous Daily Briefs
A new South Sudan brief is written every day — each with its own risk map and downloadable CSV. Here's the last week; use the calendar to go further back.
📅 Browse every day by calendar →
Highlighted days have a brief. Tap a day for that day's map & analysis, or “csv” for that day's dataset ($5).