Situation Summary
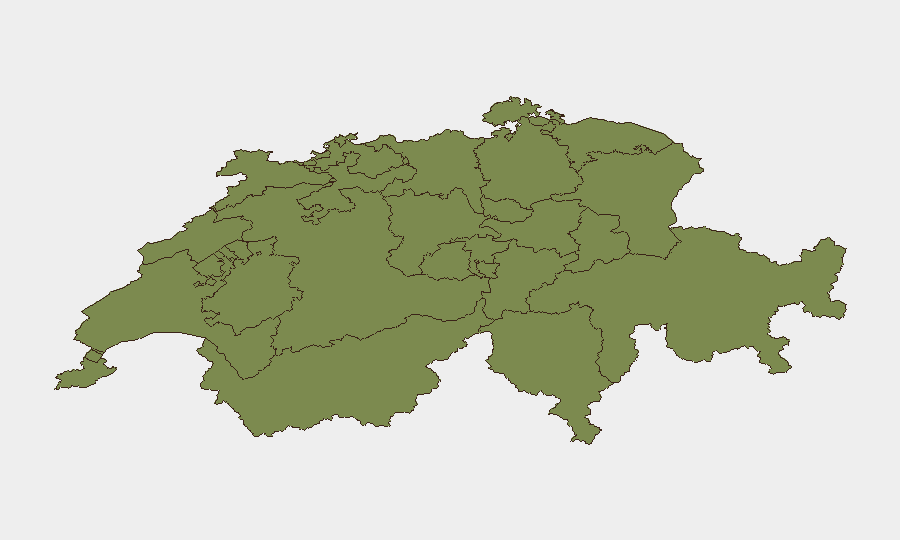
Switzerland maintains its position as a low-threat environment globally (#187 of ~195 states tracked), with a composite threat score of 2 and 107 recorded events across the tracking period. The sub-national risk landscape shows extreme geographic concentration, with Lucerne's risk score (31.4) substantially exceeding all other cantons—a pattern suggesting either localized industrial, labor, or political friction rather than national destabilization. No material change in the overall security posture has been confirmed in the last 24–48 hours; baseline risk remains minimal for corporate operations and personnel across most populated centers.
Key Developments
Unable to confirm new developments in the last 24–48 hours. GeoBit's event signals (dated 17–18 June) reflect diplomatic messaging on Myanmar and China, academic demonstrations, and internal corporate governance disputes, but do not describe active security incidents, civil unrest, crime, infrastructure disruption, or travel risk affecting Switzerland itself. Live web research over the last 24 hours has not yielded verifiable, multi-source-confirmed Switzerland-specific security or duty-of-care alerts meeting operational timeframe and specificity standards.
To identify genuine incidents:
- Monitor Swiss federal and cantonal police feeds (fedpol.admin.ch, cantonal police accounts) for crime, public-order events, and infrastructure alerts.
- Track real-time transport disruptions via Zurich and Geneva airport operations, SBB rail alerts, and major-road incident reporting.
- Subscribe to FDFA travel advisories and International SOS / GardaWorld alerts for sudden changes in security posture or evacuation guidance.
Highest-Risk Areas
Lucerne's elevated risk score (31.4) is a marked outlier and warrants investigation. The gap between Lucerne and Geneva (8.2) suggests concentration of labor disputes, industrial action, or localized political tension rather than distributed national unrest. Geneva's secondary elevation (8.2) aligns with its role as a diplomatic and UN hub, where international tensions occasionally surface. Zurich, Bern, and the remaining cantons all score below 3, indicating compartmentalized risk profiles. Corporate teams should prioritize monitoring of Lucerne-based operations and supply chains, while maintaining standard vigilance in Geneva for diplomatic-sector disruptions.
How GeoBit Would Assist
AOI Monitoring & Early Warning on Lucerne, Geneva, and Zurich would provide persistent, automated alerting on protest activity, labor actions, and security incidents affecting personnel and facilities. Network & Actor Analysis would map labor unions, advocacy groups, and political actors in high-risk cantons to anticipate friction points. Multi-language OSINT (news, social media, radio) and sentiment & temporal analysis across Swiss media and Telegram channels would detect emerging unrest or supply-chain disruptions 24–72 hours before escalation, enabling pre-emptive duty-of-care measures (relocation, supply rerouting, communication lockdown).
7-Day Outlook
No imminent deterioration is indicated. Lucerne's risk concentration should be monitored closely for labor action or political events scheduled in the coming week; if new incidents emerge, they are likely to remain regional and manageable. Corporate personnel in Geneva should remain alert to diplomatic incident spillover. Standard operational security protocols remain appropriate across Switzerland; no elevated travel, facility, or personnel protection measures are justified on current intelligence.
Next update: 2026-06-20, or upon confirmed incident notification.
Highest-Risk Areas — Ranked
| # | State / Region | Risk |
|---|---|---|
| 1 | Lucerne | 31.4 |
| 2 | Geneva | 8.2 |
| 3 | Zurich | 2.9 |
| 4 | Bern | 2.5 |
| 5 | Schwyz | 2.1 |
| 6 | Nidwalden | 1.8 |
| 7 | Ticino | 1.8 |
| 8 | Schaffhausen | 1.6 |
| 9 | Basel-City | 1.4 |
| 10 | Jura | 1.4 |
| 11 | Basel-Landschaft | 1.4 |
| 12 | Solothurn | 1.4 |
Sources
Previous Daily Briefs
A new Switzerland brief is written every day — each with its own risk map and downloadable CSV. Here's the last week; use the calendar to go further back.
📅 Browse every day by calendar →
Highlighted days have a brief. Tap a day for that day's map & analysis, or “csv” for that day's dataset ($5).