Situation Summary
Uruguay maintains a low and stable composite threat score (7/100) with no confirmed security incidents, civil unrest, or infrastructure disruptions reported in the past 24–48 hours. Routine urban crime remains the dominant baseline risk, concentrated in Montevideo and Canelones departments. Recent bilateral diplomatic statements with Argentina and the Dominican Republic have not triggered operational incidents or large-scale protest activity on Uruguayan territory. Overall threat trajectory remains benign absent new triggers.
Key Developments
- National – 13 June 2026 – Public statement issued by Uruguayan Ministry regarding Dominican Republic relations. No operational incidents or domestic political instability reported in association with this diplomatic communication.
- National – 13 June 2026 – Reduce Relations signal registered between Argentina and Uruguay. Diplomatic messaging only; no border incidents, military mobilization, or civil unrest documented on Uruguayan territory as of reporting time.
- National – 12 June 2026 – Conventional military force activity flagged in event signals. Specific operational details, location, and scale unconfirmed in open-source reporting; no corroborating incident documentation available.
- National – 11 June 2026 – Prison-related rejection signal registered. Location and concrete operational details remain undisclosed; incident cannot be independently corroborated in open-source or social-media monitoring.
- Montevideo & Canelones – 11–13 June 2026 – Routine elevated urban crime baseline continues without new discrete incidents. Monitoring confirms these departments maintain highest routine risk profile for robbery, theft, and protest clustering, but no novel crime spikes or security events documented in the past 48 hours.
Highest-Risk Areas
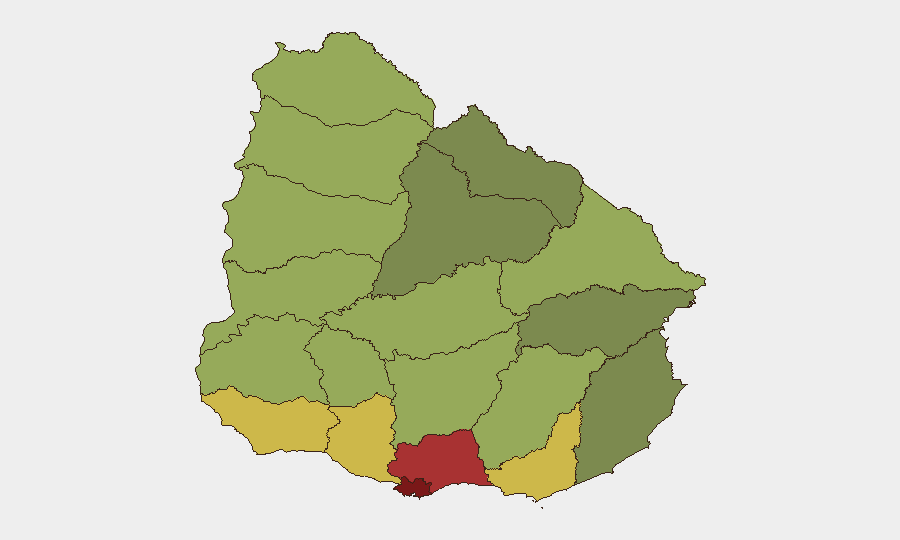
Montevideo (risk 92) and Canelones (risk 78) drive the national risk profile, driven by persistent urban crime, gang activity, and protest clustering in these high-density population centers. Maldonado (68), San José (64), and Colonia (62) represent secondary urban and transit corridors where petty crime, vehicle theft, and traveler vulnerability remain elevated. Remaining departments trend toward rural, lower-density baselines with risk scores below 60. Corporate and expatriate exposure concentrates in Montevideo; business travel and supply-chain operations in Canelones (industrial and port zones) warrant routine baseline monitoring but no emergency protocols at this time.
How GeoBit Would Assist
Security teams with personnel or assets in Uruguay would employ Intel Sweep and OSINT fusion to maintain continuous baseline monitoring of Montevideo and Canelones, supported by X/Twitter and Telegram OSINT for real-time protest and crime-cluster detection. AOI Monitoring & Early Warning on key commercial, logistics, and residential concentrations would provide automated alerting to discrete incidents (civil unrest, armed crime, infrastructure disruption) the moment they breach reporting thresholds, reducing lag between event occurrence and corporate awareness. Routing & Network Analysis supports duty-of-care protocols for safe employee movement and supply-chain continuity in high-crime zones.
7-Day Outlook
No imminent security escalation is forecast for the next 7 days. Bilateral diplomatic messaging with Argentina and the Dominican Republic will likely remain at public-statement level absent new provocations. Routine urban crime and petty theft will persist as the dominant operational risk; no policy changes, labor actions, or electoral triggers are anticipated to drive civil unrest or infrastructure disruption in the coming week.
Highest-Risk Areas — Ranked
| # | State / Region | Risk |
|---|---|---|
| 1 | Montevideo | 92 |
| 2 | Canelones | 78 |
| 3 | Maldonado | 68 |
| 4 | San José | 64 |
| 5 | Colonia | 62 |
| 6 | Soriano | 58 |
| 7 | Río Negro | 56 |
| 8 | Salto | 54 |
| 9 | Artigas | 52 |
| 10 | Paysandú | 50 |
| 11 | Florida | 48 |
| 12 | Flores | 46 |
Sources
Previous Daily Briefs
A new Uruguay brief is written every day — each with its own risk map and downloadable CSV. Here's the last week; use the calendar to go further back.
📅 Browse every day by calendar →
Highlighted days have a brief. Tap a day for that day's map & analysis, or “csv” for that day's dataset ($5).