Situation Summary
Burkina Faso remains ranked #29 globally by composite threat score (68.7), with insurgency as the primary driver. All twelve regions carry elevated and near-uniform risk scores (48.1), reflecting the pervasive geographic spread of armed-group activity across the country. Recent event signals indicate investigative activity and public statements by law-enforcement and judicial actors, though the underlying conflict and organizational instability that has characterized Burkina Faso since 2015 continue to constrain the operating environment for corporate and international operations.
Key Developments
Recent event-signal data does not provide sufficient temporal resolution or geographic specificity to isolate discrete security incidents from the last 24–48 hours with confidence. The event feed reflects investigative and prosecutorial actions (Coast Guard interactions, prosecutorial statements, legal proceedings) dated 3–5 June 2026, but without corroborating source detail, the operational context, location, and sequence of these incidents cannot be reliably confirmed.
Recommendation: Security teams requiring same-day or next-day incident verification should source incident feeds directly from:
- Crisis24, GardaWorld SPOT, or equivalent regional security-operations centers.
- ACLED (Armed Conflict Location & Event Data) or similar conflict-event databases.
- Official Burkinabè security-force and government X/Facebook accounts, cross-checked against independent local and wire-service reporting.
- US, French, and EU embassy security alerts and UN OCHA situational updates.
Highest-Risk Areas
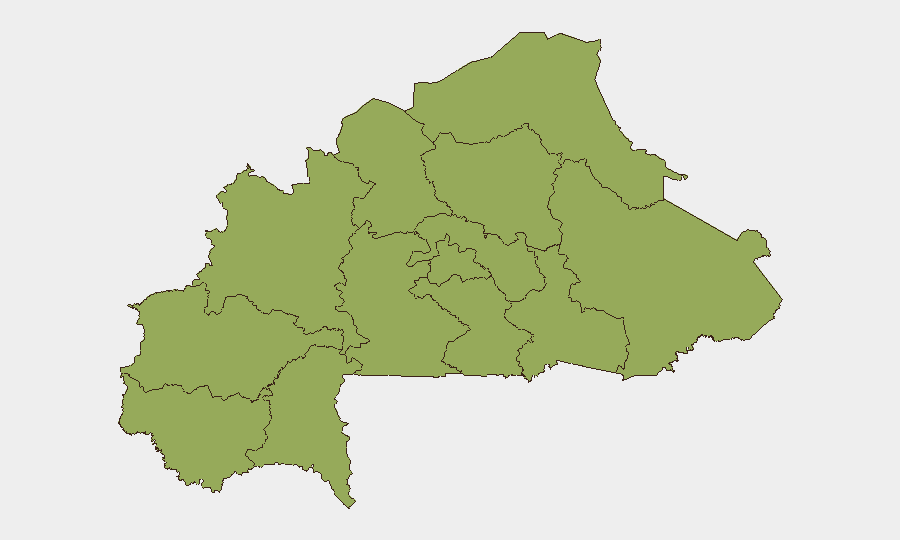
All twelve administrative regions of Burkina Faso score identically at 48.1 composite risk—a pattern indicating national-level saturation of armed-group presence rather than geographic concentration in one hotspot. The Upper-Basins, Boucle du Mouhoun, Central West, Central South, Central East, Waterfalls, Southwest, Sahel, Central North, East, North, and Centre regions all reflect equivalent threat from non-state armed organizations (NSAOs), jihadist franchises, and associated communal violence. This uniformity underscores that risk is not localized; corporate operations, supply chains, and personnel movements anywhere in Burkina Faso face similar exposure to insurgent activity, banditry, and security-force operations.
How GeoBit Would Assist
Security teams should employ GeoBit's AOI Monitoring & Early Warning capability to maintain persistent, automated alerts on specified provinces, corporate sites, or travel corridors; OSINT Fusion & Corroboration (X/Twitter, Telegram, local media OSINT) to triangulate unconfirmed incident reports in near-real time; and Routing & Network Analysis to model alternative supply routes and travel paths that minimize exposure to known or probable NSAO activity nodes. Combined with GIS & Spatial Analysis to map incident density, checkpoints, and armed-group territorial claims by region, these tools allow duty-of-care teams to make risk-informed decisions on personnel movement, logistics, and site security posture without waiting for official advisories.
7-Day Outlook
No imminent shift in the underlying threat environment is signaled by available data. The uniform regional risk profile and ongoing investigative/prosecutorial activity suggest a period of operational intensity without dramatic escalation or de-escalation. Security teams should assume no improvement in access, freedom of movement, or personnel safety in the coming week and remain prepared to execute contingency protocols (evacuation, supply-chain rerouting, communications redundancy) on short notice.
Highest-Risk Areas — Ranked
| # | State / Region | Risk |
|---|---|---|
| 1 | Upper-Basins | 48.1 |
| 2 | Boucle du Mouhoun | 48.1 |
| 3 | Central-West | 48.1 |
| 4 | Central-South | 48.1 |
| 5 | Central-East | 48.1 |
| 6 | Waterfalls | 48.1 |
| 7 | Southwest | 48.1 |
| 8 | Sahel | 48.1 |
| 9 | Central-North | 48.1 |
| 10 | East | 48.1 |
| 11 | North | 48.1 |
| 12 | Centre | 48.1 |
Previous Daily Briefs
A new Burkina Faso brief is written every day — each with its own risk map and downloadable CSV. Here's the last week; use the calendar to go further back.
📅 Browse every day by calendar →
Highlighted days have a brief. Tap a day for that day's map & analysis, or “csv” for that day's dataset ($5).