Situation Summary
Egypt maintains a composite threat score of 70 (rank #21 globally) with 104 tracked security events. Recent signal activity shows elevated political tension, including priest-led public dissent against government, localized small-arms incidents involving workers, and external military posturing by Israel and the UK near Egyptian territory. The security environment remains fragmented by geography, with Cairo significantly outpacing other governorates in incident density and risk concentration.
Key Developments
- 2026-06-12 · Cairo (inferred) – Priest-led rejection statement issued; same day, public statement from priest vs. government faction recorded. Suggests faith-leader mobilization against state authority, likely on civil or religious grievance grounds.
- 2026-06-10–12 · Countrywide – Government disapproval events and ministry-level dissent signals logged; territorial occupation by Egyptian forces also flagged, indicating possible internal repositioning or response to external pressure.
- 2026-06-11 · Location unspecified – Small-arms combat involving workers reported; suggests labor or community-level conflict escalation beyond institutional channels.
- 2026-06-11 · Suez Canal / Egypt–Israel border (inferred) – Conventional military force exchange logged between Israel and Egypt; same day, comparable signal from Britain vs. Egypt. Indicates heightened external military activity and possible naval/air posturing in contested waters or airspace.
- 2026-06-10 · Location unspecified – Conventional military force event logged between prosecutor and mayor; arrest/detention of Italian national also recorded. Implies internal law-enforcement action and possible foreign-national involvement in underlying dispute.
- 2026-06-12 · External – Virginia (US state) issued threat statement; nature and target unconfirmed, but timing aligns with military signals and may reflect diplomatic escalation or sanctions rhetoric.
Note: Open-source verification of precise incident locations and full context remains incomplete. Confirmation via paid incident feeds, embassy advisories, and direct OSINT collection is recommended.
Highest-Risk Areas
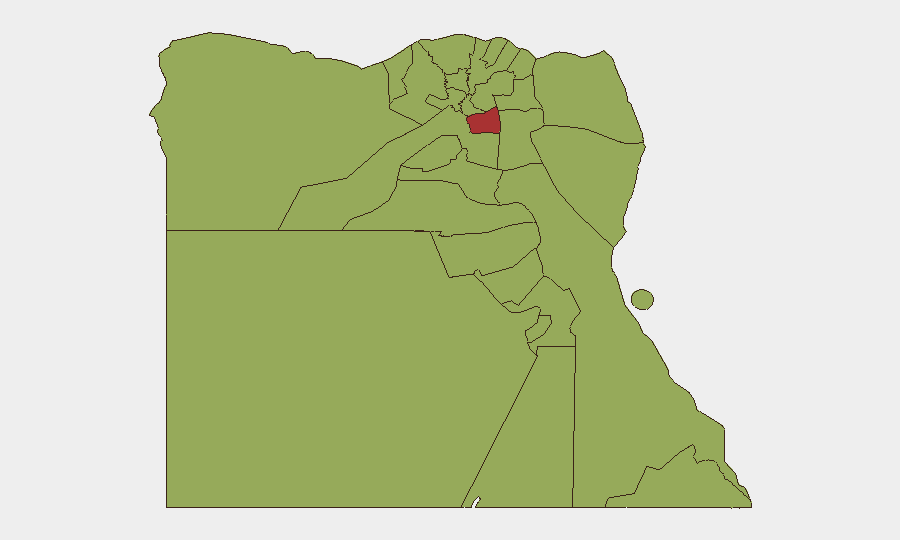
Cairo dominates the risk landscape at 79.3, reflecting high incident frequency and political sensitivity; North Sinai (58.4) and Alexandria (55.7) follow, with North Sinai driven by persistent terrorism and state-counterinsurgency activity, and Alexandria by port congestion and labor unrest. New Valley, Suez, and Ad Dakahliya cluster in the 51–55 range, with Suez Canal zone activity (military, maritime trade, energy infrastructure) and regional resource competition (oil, gas, phosphate) as primary drivers. The southern and eastern peripheries (Qena, South Sinai, Red Sea, Halaib Triangle) carry moderate but sustained risk tied to smuggling, Bedouin insurgency, and maritime piracy exposure.
How GeoBit Would Assist
AOI Monitoring & Early Warning on Cairo, North Sinai, and Suez Canal zone would provide persistent detection of protest, military movement, and port/infrastructure incidents with automated alerting. Conflict & Military tracking (force-structure analysis, weapons-capability assessment) and Network & Actor Analysis (identification of priest-led movements, labor organizers, and military command chains) enable rapid assessment of dissent actors and escalation vectors. Routing & Network Analysis supports alternative journey planning and supply-chain rerouting for personnel and cargo transiting high-risk governorates.
7-Day Outlook
Priest-led political mobilization and worker-level armed incidents suggest grassroots pressure on government legitimacy, likely to persist or widen if economic or sectarian grievances remain unaddressed. External military signals (Israel, UK, US diplomatic posture) indicate sustained strategic competition over Suez Canal and Eastern Mediterranean energy, with low probability of direct Egypt–Israel escalation but high likelihood of continued military exercises and naval presence. Recommend elevated vigilance in Cairo and Suez zone and contingency planning for supply-chain disruption or staff movement restrictions.
Highest-Risk Areas — Ranked
| # | State / Region | Risk |
|---|---|---|
| 1 | Cairo | 79.3 |
| 2 | North Sinai | 58.4 |
| 3 | Alexandria | 55.7 |
| 4 | New Valley | 55 |
| 5 | Suez | 52.7 |
| 6 | Ad Dakahliya | 51.6 |
| 7 | Suhaj | 50 |
| 8 | Eastern | 49.7 |
| 9 | Qena | 49.3 |
| 10 | South Sinai | 49.3 |
| 11 | Red Sea | 49.3 |
| 12 | Halaib Triangle | 49.3 |
Sources
Previous Daily Briefs
A new Egypt brief is written every day — each with its own risk map and downloadable CSV. Here's the last week; use the calendar to go further back.
📅 Browse every day by calendar →
Highlighted days have a brief. Tap a day for that day's map & analysis, or “csv” for that day's dataset ($5).