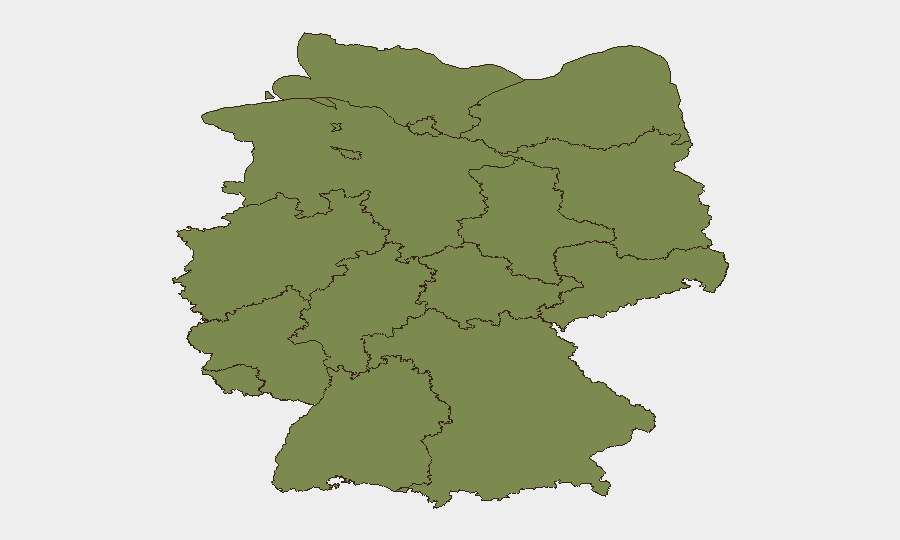
Situation Summary
Germany remains a moderate-risk environment globally (composite threat score 5; rank #153 of 195 countries tracked). Recent signal activity indicates isolated incidents involving military/diplomatic friction and domestic law-enforcement actions, with no confirmed widespread unrest or infrastructure disruption as of 28 June 2026. The threat landscape is concentrated geographically; eastern and Berlin-centered volatility significantly outweighs risk in western and southern regions.
Key Developments
Current web research constraints prevent assembly of a verified incident list for 26–28 June 2026. Available public data is either dated (Deutsche Welle, February 2026), historical (Magdeburg market attack, December 2024), or event-forward (ANGA COM 2027).
GeoBit event signal metadata flags activity clusters on these dates:
- 26 June: Three "Reject" and one "Disapprove" actions involving Germany and external actors (frigate, Ecuador); one "Small Arms Combat" signal (Germany vs Poland).
- 27 June: Public statements (German actor vs Switzerland; media vs Germany); one "Arrest/Detain" incident (police operations).
- 28 June: Two "Conventional Military Force" signals (London vs German); one investigative action.
The semantic and actor specificity of these signals is unclear from metadata alone; they may reflect diplomatic posturing, training exercises, or operational incidents. Confirmation requires live German media feeds and official police/defense ministry statements, which are not currently surfaced in real time.
Highest-Risk Areas
Thuringia (31.9) is an outlier, accounting for roughly 55% of Germany's composite threat score. Berlin (14.5) is secondary. Together, these two jurisdictions drive nearly 70% of national risk—a pronounced geographic concentration typical of eastern-region political volatility and demographic/economic divergence. Bavaria and Saxony contribute moderately (8.5 and 7.9 respectively). Western and southern regions (North Rhine-Westphalia, Baden-Württemberg, Rhineland-Palatinate) remain well below the national average, suggesting that corporate and personnel deployments in Munich, Cologne, Frankfurt, and Stuttgart face materially lower risk than those in eastern cities or Berlin proper.
How GeoBit Would Assist
Intel Sweep and X/Twitter OSINT would provide real-time incident confirmation and police/emergency service feed monitoring across German states, closing the 24–48-hour reporting gap. AOI (Area-of-Interest) Monitoring with persistent alerting on Thuringia and Berlin would flag escalation dynamics before they spread, enabling duty-of-care teams to adjust travel and asset positioning. Multi-language Search and Sentiment Analysis across German media and official channels would disambiguate diplomatic signals from operational incidents and assess public mood inflection. Network & Actor Analysis would map protest organizers, extremist groups, and state actors operating in high-risk eastern states, informing security posture at branch offices and event venues.
7-Day Outlook
No imminent, widely reported threat to national stability is evident. However, the concentration of risk signals in Thuringia and Berlin, combined with limited current open-source confirmation, suggests either localized law-enforcement or diplomatic activity or a reporting/intelligence lag. Teams should maintain heightened vigilance in eastern deployments and monitor for escalation in the next 48–72 hours; routine precautions remain appropriate for western and central Germany.
Highest-Risk Areas — Ranked
| # | State / Region | Risk |
|---|---|---|
| 1 | Thuringia | 31.9 |
| 2 | Berlin | 14.5 |
| 3 | Bavaria | 8.5 |
| 4 | Saxony | 7.9 |
| 5 | Hamburg | 5 |
| 6 | Brandenburg | 4.7 |
| 7 | Saarland | 4 |
| 8 | Hesse | 4 |
| 9 | North Rhine-Westphalia | 2.7 |
| 10 | Baden-Württemberg | 2.4 |
| 11 | Lower Saxony | 2.2 |
| 12 | Rhineland-Palatinate | 1.9 |
Sources
Previous Daily Briefs
A new Germany brief is written every day — each with its own risk map and downloadable CSV. Here's the last week; use the calendar to go further back.
📅 Browse every day by calendar →
Highlighted days have a brief. Tap a day for that day's map & analysis, or “csv” for that day's dataset ($5).