Situation Summary
Iceland maintains its position as one of the world's lowest-threat environments, with a composite threat score of 9 and no confirmed acute security incidents in the last 24–48 hours. The Capital Region drives the majority of tracked risk (score 24), reflecting concentration of population, government, and infrastructure rather than active instability. Baseline security posture remains stable; volcanic monitoring on the Reykjanes Peninsula continues under routine observation with no new eruptions or evacuations reported.
Key Developments
- No corroborated new security incidents in Iceland, 10–12 June 2026. Available open sources, travel advisories, airline operations, and Icelandic public statements do not indicate protests, infrastructure failures, political crises, or civil unrest in the last 24–48 hours.
- Svartsengi volcanic activity (Reykjanes Peninsula, ongoing). The Icelandic Meteorological Office confirms continued magma accumulation and crustal uplift in this long-running episode; no new eruption or evacuation order has been issued. This remains a monitoring item, not an acute event.
- Regional diplomatic signal: Iceland–France relations. GeoBit event data registers a "Reduce Relations" signal between Iceland and France on 12 June; no specific incident details are available from open sources, and the impact on corporate operations or personnel movement is not yet clear. Security teams should monitor for any trade, visa, or diplomatic-access changes.
- Ambient Middle East–related sentiment. Event signals reflect broader regional tensions (Iran–US threats, Israel–military conflict, settler violence) visible in Icelandic social media and opposition messaging, but no direct Iceland-based incident or threat is evident. Universities and civil-society bodies have issued public disapproval statements on regional issues.
Highest-Risk Areas
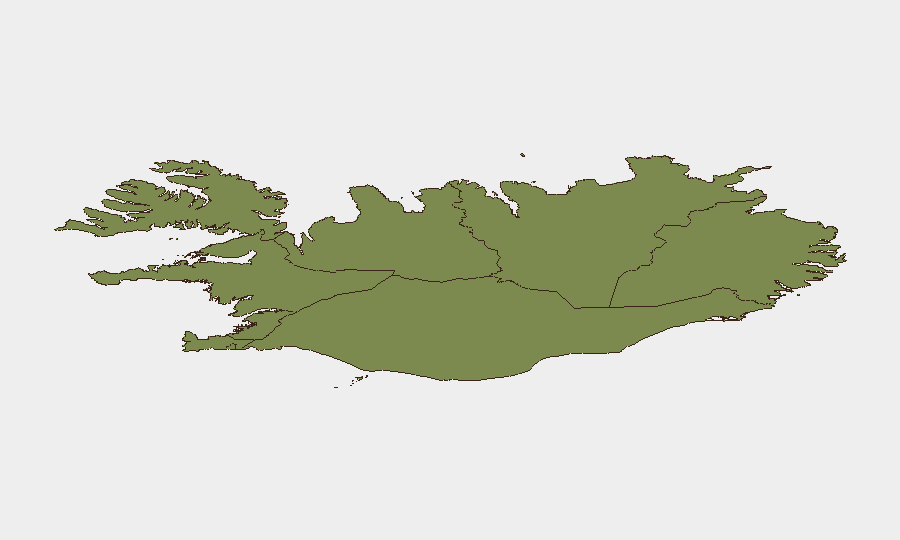
The Capital Region (Reykjavik area and surroundings) accounts for nearly 67% of Iceland's tracked composite risk score, reflecting concentration of government, diplomatic missions, major employers, and critical infrastructure rather than active violence or unrest. The Southern Peninsula (Reykjanes, score 12) remains the secondary risk driver, primarily due to ongoing volcanic activity and associated infrastructure (airport, power generation, tourism). The Southern Region (score 11) and Eastern Region (score 10) carry lower, stable risk profiles. All other regions score below 10, reflecting Iceland's overall peaceful, dispersed settlement pattern.
How GeoBit Would Assist
Security teams managing personnel or assets in Iceland should employ AOI Monitoring & Early Warning to track the Capital Region and Reykjanes Peninsula for any sudden shifts in political activity, demonstrations, or volcanic escalation. Conflict & Military and Network & Actor Analysis capabilities enable tracking of sentiment shifts tied to regional Middle East tensions and any spillover into Icelandic civil discourse or diaspora communities. Environmental & Health monitoring of Svartsengi provides structured alerting on volcanic status changes that could affect airport operations or critical infrastructure.
7-Day Outlook
No acute threat escalation is forecast for the next seven days. Volcanic monitoring will continue on a routine cycle, and diplomatic relations with France warrant observation for any cascade effects on travel or trade. The overall risk environment is expected to remain at baseline unless significant regional instability (Middle East escalation) or new local incident drives a measurable change.
Highest-Risk Areas — Ranked
| # | State / Region | Risk |
|---|---|---|
| 1 | Capital Region | 24 |
| 2 | Southern Peninsula | 12 |
| 3 | Southern Region | 11 |
| 4 | Eastern Region | 10 |
| 5 | Western Region | 9 |
| 6 | Westfjords Region | 8 |
| 7 | Northwestern Region | 7 |
| 8 | Northeastern Region | 6 |
Sources
Previous Daily Briefs
A new Iceland brief is written every day — each with its own risk map and downloadable CSV. Here's the last week; use the calendar to go further back.
📅 Browse every day by calendar →
Highlighted days have a brief. Tap a day for that day's map & analysis, or “csv” for that day's dataset ($5).