Situation Summary
New Zealand remains a stable operating environment with a composite global threat ranking of #113 and an overall threat score of 6. No major security incidents, civil unrest, infrastructure failures, or acute threats have been corroborated in open sources over the past 24–48 hours. Routine governance and health-sector policy statements have been documented, but these do not indicate elevated near-term security risk to corporate operations or personnel.
Key Developments
- Nationwide (2026-06-20): A regulator issued a public statement; no specific security, safety, or operational disruption has been reported in available sources.
- Nationwide (2026-06-20): Community and healthcare sector voices issued public statements; these appear linked to ongoing policy discourse rather than acute incidents.
- Nationwide (2026-06-18): Ministry of Health and broader governance entities released public statements. Social media and indexed content reference longer-running legal and administrative matters (e.g., Nursing Council restructuring) rather than new security events.
- Fisheries sector (2026-06-18): A fisher issued a public statement; no disruption to maritime operations or supply chains has been corroborated.
- Nationwide (2026-06-18): A disapproval statement and rejection signals were recorded; these reflect political or administrative disagreement rather than violence, unrest, or travel disruption.
- Energy infrastructure: Transpower's live system feed shows normal generation and no reported grid emergencies or significant outages for 19–20 June.
- Natural hazards: MetService and NZTA data show no major earthquakes, severe weather events, or travel-disrupting conditions in the past 24–48 hours.
Highest-Risk Areas
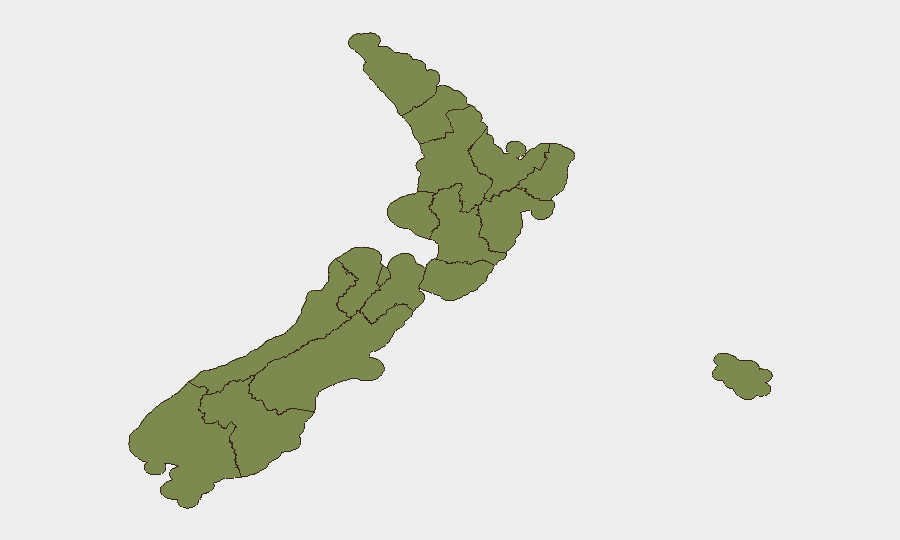
Canterbury dominates the sub-national risk profile with a composite score of 31.4—approximately three times higher than any other region. Wellington (9.7) and the Chatham Islands (9.5) follow at considerable distance, while Southland and Waikato score below 7. The Canterbury elevation warrants focused monitoring; however, no acute incident has been corroborated in open sources in the past 48 hours that explains the current ranking. Security teams with operations or personnel in Canterbury should prioritize baseline risk profiling and establish persistent area-of-interest monitoring to detect emerging signals.
How GeoBit Would Assist
Intel Sweep and OSINT fusion across X/Twitter, local media, police statements, and Telegram would provide early warning of civil unrest, protest activity, or crime spikes not yet visible in mainstream outlets. AOI Monitoring and Early Warning on Canterbury and Wellington—paired with persistent watches on New Zealand Police, NEMA, and NZ civil aviation feeds—would alert security teams to infrastructure disruption, natural hazards, or major incidents within hours of occurrence. Routing and Network Analysis combined with maritime and aviation tracking would enable duty-of-care teams to plan alternative routes and assess travel feasibility for personnel or supply chains in real time.
7-Day Outlook
No indicators suggest imminent escalation of security threats in New Zealand over the next seven days. Continued baseline monitoring of governance statements, health-sector developments, and regional signals in Canterbury and Wellington is recommended to maintain early-warning posture. Standard travel and personnel security protocols remain appropriate; no heightened alert status is warranted at this time.
Highest-Risk Areas — Ranked
| # | State / Region | Risk |
|---|---|---|
| 1 | Canterbury | 31.4 |
| 2 | Wellington | 9.7 |
| 3 | Chatham Islands | 9.5 |
| 4 | Southland | 6.5 |
| 5 | Waikato | 3.8 |
| 6 | Otago | 3.4 |
| 7 | Auckland | 3.1 |
| 8 | Bay of Plenty | 2.7 |
| 9 | Manawatū-Whanganui | 2.1 |
| 10 | Northland | 1.7 |
| 11 | Hawke's Bay | 1.7 |
| 12 | West Coast | 1.7 |
Sources
Previous Daily Briefs
A new New Zealand brief is written every day — each with its own risk map and downloadable CSV. Here's the last week; use the calendar to go further back.
📅 Browse every day by calendar →
Highlighted days have a brief. Tap a day for that day's map & analysis, or “csv” for that day's dataset ($5).