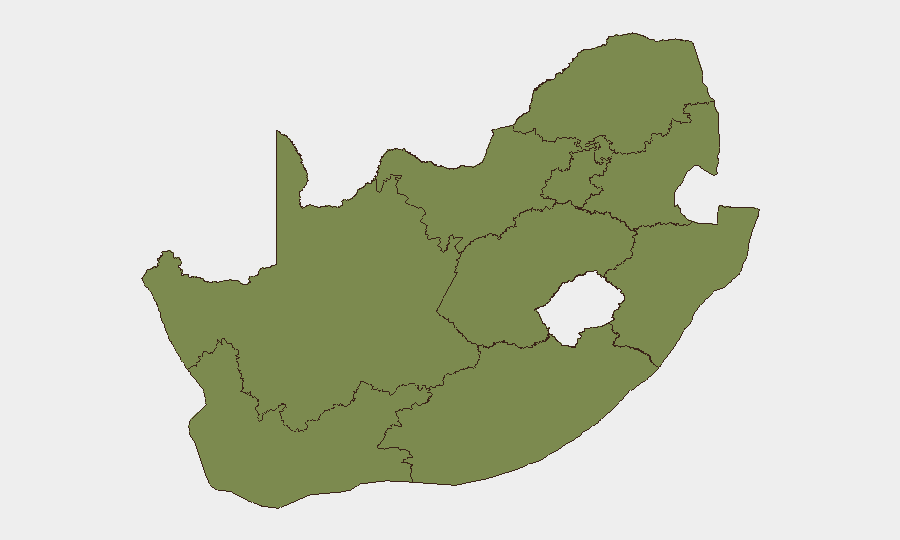
Situation Summary
South Africa remains at composite threat rank #59 globally with 970 tracked events, reflecting elevated but not critical national risk (score 15). Gauteng province—home to Johannesburg and Pretoria—drives the majority of threat activity with a risk score nearly 3× the national average, while Free State and KwaZulu-Natal contribute secondary concentrations. The security environment is characterized by persistent urban crime, service-delivery unrest, and localized civil tensions rather than active large-scale conflict or state collapse.
Key Developments
Unable to corroborate specific, timestamped incidents from the last 24–48 hours in South Africa with sufficient confidence for this brief. Live web research conducted on 2026-06-17 did not yield recent on-the-ground events that meet the recency, geographic specificity, and source-verification standards required for duty-of-care reporting. GEOBIT event signals catalogued for 2026-06-15 to 2026-06-17 include international diplomatic tensions (South Korea, South Carolina, presidential statements) and judicial actions, but do not resolve to confirmed operational incidents within South Africa's borders during this period.
Recommendation: Consult real-time feeds from SAPS (South African Police Service) official channels, provincial disaster-management centers, and verified South African news outlets (e.g., News24, eNCA, Daily Maverick) for same-day incident confirmation before making operational decisions.
Highest-Risk Areas
Gauteng (risk 32.5) is the primary driver of national threat activity and warrants priority monitoring. The province encompasses Johannesburg metropolitan area, the administrative capital Pretoria, and surrounding industrial zones—economic and political nerve centers that concentrate both criminal targeting and civil unrest. Free State (11.9) and KwaZulu-Natal (10.0) represent secondary concentrations, likely tied to inter-communal tensions, service-delivery protests, and organized crime networks. Western Cape, Eastern Cape, and remaining provinces remain below risk 6, reflecting lower incident frequency but not zero vulnerability. Risk concentration in Gauteng suggests that corporate security resources should prioritize personnel safety, asset protection, and supply-chain resilience in the greater Johannesburg–Pretoria corridor.
How GeoBit Would Assist
Security and risk teams should employ AOI Monitoring & Early Warning to establish persistent watches on Gauteng, Free State, and KwaZulu-Natal, with automated alerting on security incidents, protests, and transport disruptions affecting staff and operations. Intel Sweep and multi-language OSINT (X/Twitter, Telegram, local news feeds) provide continuous detection of emerging threats and sentiment shifts before they escalate. Routing & Network Analysis enables real-time alternative journey planning for personnel and supply chains when primary routes (highways, airports, urban thoroughfares) are compromised by unrest or crime.
7-Day Outlook
No imminent major escalation is signaled, but baseline risk in Gauteng and Free State will likely remain elevated through service-delivery disputes and opportunistic crime. Personnel in high-risk provinces should maintain heightened situational awareness and adhere to established movement protocols. Corporate security teams are advised to refresh incident-response procedures and verify contact chains with local authorities and emergency services.
Highest-Risk Areas — Ranked
| # | State / Region | Risk |
|---|---|---|
| 1 | Gauteng | 32.5 |
| 2 | Free State | 11.9 |
| 3 | KwaZulu-Natal | 10 |
| 4 | Western Cape | 5.9 |
| 5 | Eastern Cape | 5.9 |
| 6 | Mpumalanga | 3.5 |
| 7 | Limpopo | 2.4 |
| 8 | Northern Cape | 2.4 |
| 9 | North West | 2.4 |
Previous Daily Briefs
A new South Africa brief is written every day — each with its own risk map and downloadable CSV. Here's the last week; use the calendar to go further back.
📅 Browse every day by calendar →
Highlighted days have a brief. Tap a day for that day's map & analysis, or “csv” for that day's dataset ($5).