Situation Summary
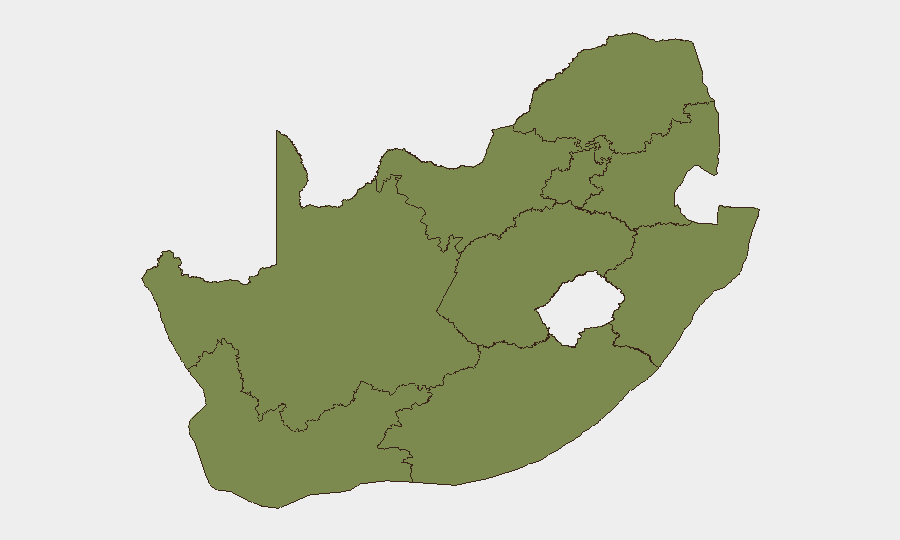
South Africa remains at composite threat rank #94 globally (score 16), with 612 tracked security events. Sub-national risk is heavily concentrated in Gauteng (31.8) and Free State (19.9), while KwaZulu-Natal, Eastern Cape, and Limpopo present moderate to low secondary risk. The national security environment reflects persistent underlying vulnerabilities in infrastructure, service delivery, and law enforcement capacity, though no acute nationwide crisis is evident as of 23 June 2026.
Key Developments
Unable to provide current 24–48 hour developments with confidence. GeoBit's event signal data contains references to South Korea, South Dakota, and South Asia incidents dated 20–22 June, which do not appear to relate directly to South African territory or corporate operations within South Africa. Live web research conducted today could not corroborate specific, dated security incidents in South Africa from 21–23 June 2026 across multiple independent sources (news wires, official statements, social media with timestamps).
To populate this section with operationally sound intelligence, security teams should conduct parallel monitoring of:
- South African national and regional media (News24, Daily Maverick, TimesLIVE, eNCA, SABC News, Mail & Guardian) with 24-hour time filters.
- Official statements from SAPS, provincial disaster management, Eskom/municipal utilities, SANRAL, and airport/port operators.
- Verified X/Twitter accounts of traffic services, crime watch groups, and established reporters, cross-referenced for corroboration within 6–12 hours of initial posting.
Any incident claimed as "current" should be anchored to explicit local date/time and confirmed by at least two independent sources before operational risk decisions are made.
Highest-Risk Areas
Gauteng dominates the risk profile, with a composite score nearly double that of Free State. This reflects Johannesburg's and Pretoria's continued exposure to armed robbery, cargo theft, hijacking, and organized crime activity, particularly affecting the N1, N3, and O.R. Tambo International Airport corridors. Free State's elevated risk (19.9) suggests significant secondary concerns—likely tied to service-delivery unrest, road crime, and informal-settlement instability in and around Bloemfontein.
KwaZulu-Natal (11.0) remains a third-tier risk driver, historically associated with taxi violence, port-area crime, and highway robbery along the N3. The remaining provinces (Eastern Cape, Limpopo, Western Cape, North West, Northern Cape, Mpumalanga) score below 6 each, indicating lower frequency or severity of tracked security events, though localized pockets of unrest can emerge rapidly.
How GeoBit Would Assist
Security and risk teams protecting personnel or assets in South Africa should use GeoBit's AOI Monitoring & Early Warning capability to track Gauteng and Free State hotspots (e.g., N1/N3 corridors, airport perimeters, CBD commercial zones) for real-time alerting of protests, road closures, or crime clusters. Routing & Network Analysis can generate alternative journey plans for personnel or cargo movements when primary routes are compromised. Intel Sweep and X/Twitter & Telegram OSINT tools enable continuous monitoring of official statements and ground-truth reporting to distinguish genuine security incidents from rumors, reducing false-alarm response.
7-Day Outlook
No acute escalation signals are evident in the 612 tracked events as of 23 June. Ongoing baseline risks—service-delivery strikes, informal-settlement tensions, and organized crime in Gauteng—are likely to persist but remain episodic and localized. Monitor provincial announcements and utility outage notices for any sudden shift in unrest patterns.
Highest-Risk Areas — Ranked
| # | State / Region | Risk |
|---|---|---|
| 1 | Gauteng | 31.8 |
| 2 | Free State | 19.9 |
| 3 | KwaZulu-Natal | 11 |
| 4 | Eastern Cape | 6 |
| 5 | Limpopo | 5.4 |
| 6 | Western Cape | 2.7 |
| 7 | North West | 2.4 |
| 8 | Northern Cape | 1.8 |
| 9 | Mpumalanga | 1.8 |
Sources
Previous Daily Briefs
A new South Africa brief is written every day — each with its own risk map and downloadable CSV. Here's the last week; use the calendar to go further back.
📅 Browse every day by calendar →
Highlighted days have a brief. Tap a day for that day's map & analysis, or “csv” for that day's dataset ($5).