Situation Summary
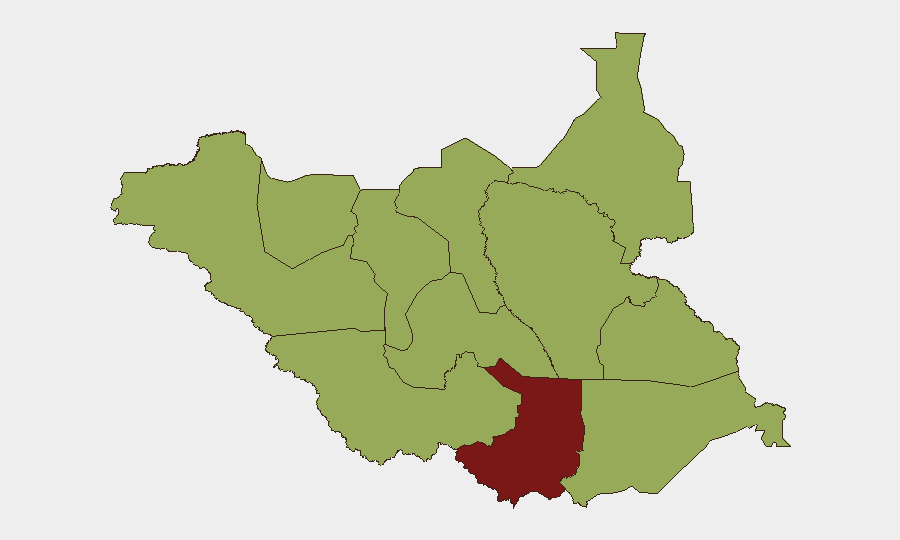
South Sudan remains classified as threat rank #20 globally, with a composite threat score of 80.2 driven primarily by factional violence across 107 tracked events. Central Equatoria State represents the single highest-risk zone (86.1), while a second tier of 11 states and administrative areas—including Upper Nile, Unity, Jonglei, and both Bahr el Ghazal regions—each register 56.1 composite risk, indicating persistent armed-group activity, inter-communal conflict, and state fragility. The security environment remains volatile with limited signs of near-term de-escalation.
Key Developments
Data Limitation Notice: Real-time incident feeds for South Sudan (past 24–48 hours) cannot be reliably confirmed from open-source web search and social channels currently accessible. Recent search results contain either undated general reporting on famine, regional Sudan spillover, or political dialogue processes, rather than specific, time-stamped incidents. No confirmed discrete security events with precise location and date stamps for 2026-06-09 or 2026-06-10 can be attributed at this time.
Recommended action: Security teams should rely on direct feeds from UNMISS (UN Mission in South Sudan), OCHA South Sudan situation reports, Eye Radio, Radio Tamazuj, and verified local stringers for same-day incident confirmation, rather than relying on delayed open-source aggregation.
Highest-Risk Areas
Central Equatoria (risk 86.1)—encompassing Juba and surrounding counties—remains the primary concern due to political volatility, armed-group presence, and criminal networks in the capital region. A second cluster of 11 provinces and administrative areas each scoring 56.1 risk span the oil-producing regions (Unity, Ruweng, Upper Nile), pastoral conflict zones (Lakes, Warrap, Jonglei, Greater Pibor), and western frontier states (Western and Eastern Equatoria, Western Bahr el Ghazal, Northern Bahr el Ghazal). This dispersion reflects fragmented command-and-control, inter-communal resource disputes, and the ongoing structural absence of state monopoly on force outside Juba.
How GeoBit Would Assist
Teams with personnel or assets in South Sudan should prioritize AOI (Area-of-Interest) Monitoring & Early Warning on critical installations, staff residences, and supply-route chokepoints in Central Equatoria and oil-producing states, with persistent alerting on incident escalation within defined buffers. Conflict & Military mapping combined with Network & Actor Analysis enables tracking of factional positions, supply lines, and leader movements to anticipate flashpoints ahead of public reporting. Satellite & Imagery Analysis of checkpoints, military encampments, and border crossing activity in Upper Nile and Unity states provides ground truth on force posture and freedom-of-movement risk.
7-Day Outlook
No major political settlement, security-force restructuring, or external de-escalation event is signaled for the immediate week ahead. Factional violence and criminal activity are expected to remain at current baseline levels, with elevated risk during movement of humanitarian convoys, payroll operations, and staff rotation in Central Equatoria. Monitoring for spillover from Sudan's ongoing conflict (particularly in Upper Nile border zones) should continue as a secondary threat vector.
Report Date: 2026-06-10 | Data Refresh: Daily | Next Update: 2026-06-11
Highest-Risk Areas — Ranked
| # | State / Region | Risk |
|---|---|---|
| 1 | Central Equatoria | 86.1 |
| 2 | Upper Nile | 56.1 |
| 3 | Northern Bahr el Ghazal | 56.1 |
| 4 | Western Bahr el Ghazal State | 56.1 |
| 5 | Ruweng Administrative Area | 56.1 |
| 6 | Unity | 56.1 |
| 7 | Warrap | 56.1 |
| 8 | Lakes | 56.1 |
| 9 | Jonglei | 56.1 |
| 10 | Greater Pibor Administrative Area | 56.1 |
| 11 | Western Equatoria | 56.1 |
| 12 | Eastern Equatoria | 56.1 |
Sources
Previous Daily Briefs
A new South Sudan brief is written every day — each with its own risk map and downloadable CSV. Here's the last week; use the calendar to go further back.
📅 Browse every day by calendar →
Highlighted days have a brief. Tap a day for that day's map & analysis, or “csv” for that day's dataset ($5).