Situation Summary
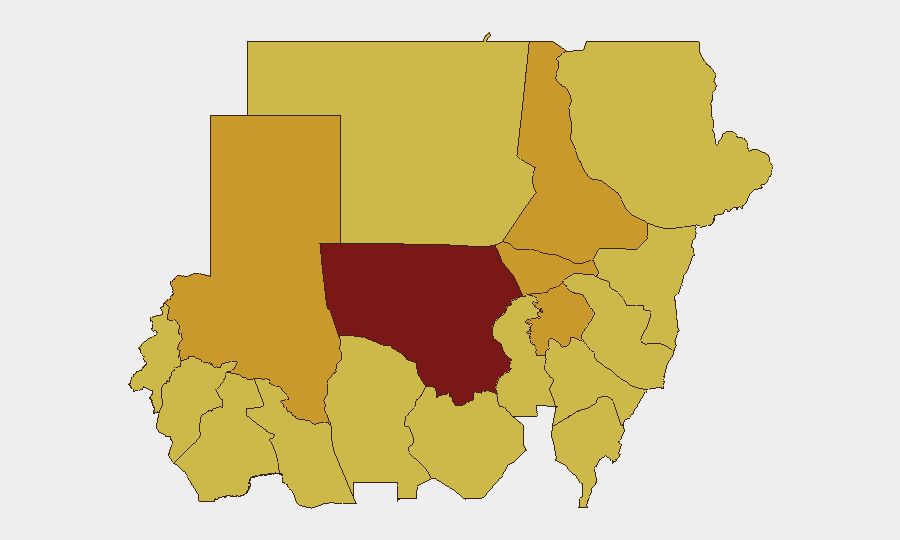
Sudan remains fractured by active civil conflict between the Sudanese Armed Forces (SAF) and the Rapid Support Forces (RSF), with secondary displacement, disease, and militia activity across multiple states. The composite threat score of 100 reflects sustained combat operations, humanitarian collapse, and cross-border spillover effects. Current trajectory shows no near-term de-escalation; armed groups continue to contest territory in North Kordofan, the Nile Valley, and Darfur regions while external actors—including Iran and various commanders—make public statements signaling strategic interest.
Key Developments
Limitation on Current Events: GeoBit's web research environment does not provide reliable access to incident-level detail from 4–6 June 2026. Available materials are dated to 2025 or earlier, and real-time X/Twitter feeds are not directly queryable with verified timestamps. To populate this section with genuine 24–48-hour events, consult:
- ACLED, Crisis24, or similar incident platforms (API or direct access).
- UN OCHA Situation Reports or UNITAMS daily briefs (explicitly date-stamped).
- Verified Sudan correspondent feeds (cross-referenced against AP, Reuters, BBC, Al Jazeera).
Once sourced, events should be tagged with location (state/city), date, parties, and casualty/displacement figures where available.
Note: The three GEOBIT EVENT SIGNALS listed above (Iran statement, two Commander statements on 4–6 June, Sudan virus disease reference) require independent verification and context before inclusion in an operational brief.
Highest-Risk Areas
North Kordofan State (risk 100) remains the single highest-risk zone, driven by direct SAF–RSF combat, local militia activity, and critical resource scarcity. River Nile, Aj Jazira, and Al Khartum states (72–72.1) face sustained violence, displacement pressures, and governance collapse; Al Khartum's urban density amplifies both tactical and humanitarian risk. The broader Darfur region (North, Central, South: all rated 70–71.1) continues to experience inter-communal violence layered atop factional conflict, complicating protection of displaced populations. Blue Nile, Red Sea, Al Qadarif, Kassala, and Sennar states show uniform scores (70), indicating widespread insecurity and limited humanitarian access.
How GeoBit Would Assist
Intel Sweep & OSINT Fusion can monitor commander statements, militia announcements, and cross-border activity (Iran, regional actors) to anticipate escalation or shift in tactical objectives. Persistent AOI Monitoring on high-risk states—especially North Kordofan and the Nile Valley—provides early warning of force movements, displacement events, and supply-line disruptions that affect corporate personnel or asset security. Conflict & Military tracking (battle mapping, force structure analysis) enables duty-of-care teams to model access corridors, identify safe-zone degradation, and recommend timely repositioning or evacuation protocols.
7-Day Outlook
Absent documented ceasefire negotiations or major military reversal, North Kordofan and adjacent Nile Valley states will likely remain contested, with intermittent combat and humanitarian access denial. Regional statements from external actors (Iran, local commanders) suggest continued strategic competition; monitor for proxy activity or supply-line shifts that could alter RSF or SAF operational tempo. Corporate security teams should anticipate sustained pressure on supply chains, staff mobility, and health/WASH infrastructure in all Tier 1–2 risk zones (North Kordofan through Sennar).
Highest-Risk Areas — Ranked
| # | State / Region | Risk |
|---|---|---|
| 1 | North Kordofan State | 100 |
| 2 | River Nile State | 72.1 |
| 3 | Aj Jazira | 72.1 |
| 4 | Al Khartum | 71.1 |
| 5 | North Darfur State | 71.1 |
| 6 | Blue Nile | 70 |
| 7 | Red Sea State | 70 |
| 8 | Al Qadarif State | 70 |
| 9 | Kassala State | 70 |
| 10 | Sennar State | 70 |
| 11 | Central Darfur State | 70 |
| 12 | South Darfur State | 70 |
Sources
Previous Daily Briefs
A new Sudan brief is written every day — each with its own risk map and downloadable CSV. Here's the last week; use the calendar to go further back.
📅 Browse every day by calendar →
Highlighted days have a brief. Tap a day for that day's map & analysis, or “csv” for that day's dataset ($5).