Situation Summary
The United States maintains a composite threat score of 3.3 (rank #61 globally) with 4,127 tracked events, indicating fragmented but persistent security pressures across multiple vectors—political friction, criminal activity, and isolated civil-disorder signals. California and Kansas rank significantly above all other states, with California's score of 32.3 nearly 40% higher than the national baseline, driven by concentrated event density. Recent signal activity points to intersecting tensions: presidential disapproval statements, property-rights disputes, police engagement, and unconfirmed threat utterances targeting actors, with no single dominant driver dominating the national picture.
Key Developments
- 2026-06-09 · Property Rights Dispute (Washington): Investigation initiated into property owner conflict with authorities; location and scope unconfirmed in available reporting.
- 2026-06-09 · School Public Statement: Institution-level communication issued; subject matter and location not yet clarified in source materials.
- 2026-06-09 · Threat Signal (Actor Target): Terrorist-attributed threat against entertainment/public figure; Orlando and UK actors also issued related public statements same day, suggesting possible coordinated narrative or international angle.
- 2026-06-08 · Presidential Disapproval Signal: Public disapproval statement issued at executive level; typical of ongoing political polarization but tracked as mood indicator.
- 2026-06-07 · Police Small Arms Engagement: Armed law-enforcement action logged; no casualty or location detail in summary data.
- 2026-06-07 · Criminal Investigation Launch: General criminal investigation initiated; specifics unavailable in current brief.
- 2026-06-07 · Arrest/Detain (Federal): U.S. federal-level detention action; no charges or context provided in summary.
- 2026-06-08 · Wisconsin Public Statement: Regional public statement; context not specified.
*Note:* Detailed locations, incident context, and causal links remain incomplete in available research. Cross-referencing with live news sources recommended before operational decisions.
Highest-Risk Areas
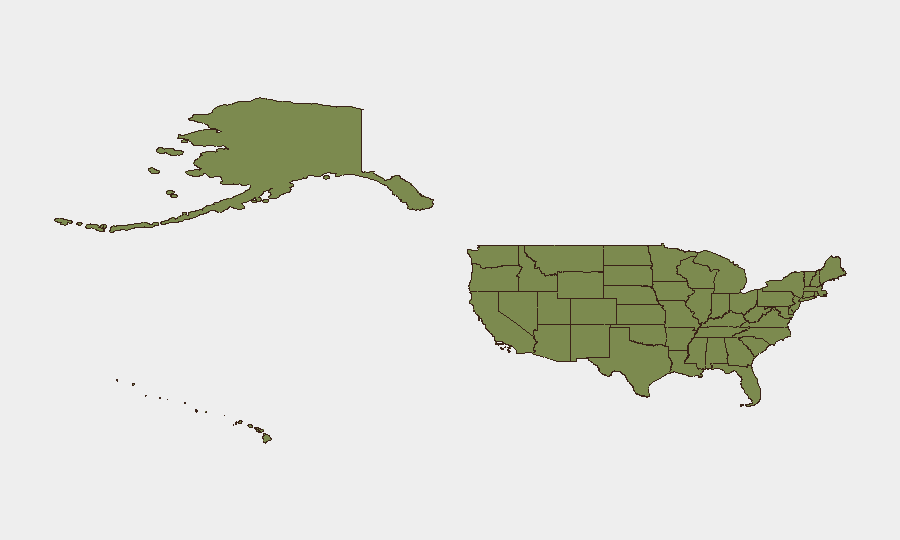
California (32.3) and Kansas (29.1) drive national risk concentration, with California's score reflecting both population density and tracked event volume, while Kansas's elevated ranking suggests either emerging instability or concentrated reporting bias requiring field validation. New York (19.3) and Texas (18.0) follow at mid-tier risk, typical of major metropolitan and border-adjacent jurisdictions. The sharp drop-off after the top four states indicates risk is not evenly distributed; security operations should prioritize West Coast and Great Plains monitoring, with secondary focus on Northeast and Texas corridors. Virginia, Pennsylvania, and Illinois (12.4, 12.3, 11.8 respectively) represent tertiary concern zones, often tied to federal activity, logistics nodes, and urban crime dynamics.
How GeoBit Would Assist
A corporate security team would deploy Intel Sweep and OSINT fusion to correlate the fragmented event signals above with real-time news, X/Twitter, and Telegram feeds to establish causal chains and confirm incident severity. AOI (Area-of-Interest) Monitoring & Early Warning would enable persistent watch on California, Kansas, New York, and Texas with threshold-based alerts on criminal, protest, and infrastructure-disruption keywords, reducing reaction time. GIS & Spatial Analysis combined with network actor analysis would map threat actor concentrations, protest node locations, and law-enforcement deployment patterns to identify travel chokepoints and safe/at-risk facilities in real time.
7-Day Outlook
Near-term trajectory remains ambiguous; the absence of a clear dominant incident or organized actor mobilization suggests fragmented, localized pressure rather than nationwide escalation. Monitor presidential messaging cadence, school and property-rights dispute resolution timelines, and any clarification of the actor-threat claim over the next 72 hours as leading indicators of whether these are isolated events or early signals of broader coordination.
Highest-Risk Areas — Ranked
| # | State / Region | Risk |
|---|---|---|
| 1 | California | 32.3 |
| 2 | Kansas | 29.1 |
| 3 | New York | 19.3 |
| 4 | Texas | 18 |
| 5 | Ohio | 16.1 |
| 6 | Virginia | 12.4 |
| 7 | Pennsylvania | 12.3 |
| 8 | Illinois | 11.8 |
| 9 | Florida | 11.6 |
| 10 | Massachusetts | 11.4 |
| 11 | South Carolina | 8.8 |
| 12 | Kentucky | 8.4 |
Sources
Previous Daily Briefs
A new United States brief is written every day — each with its own risk map and downloadable CSV. Here's the last week; use the calendar to go further back.
📅 Browse every day by calendar →
Highlighted days have a brief. Tap a day for that day's map & analysis, or “csv” for that day's dataset ($5).