Situation Summary
Australia's composite threat score of 5 places it at #131 globally, reflecting a stable but fragmented security environment shaped by sub-national disparities and ongoing political-labor tensions. Recent event signals show elevated political discourse volatility, international diplomatic friction (notably with Laos), and isolated community-government friction, but no systemic national crisis is apparent. The Northern Territory and New South Wales account for disproportionate risk concentration, while most southern and island territories remain comparatively low-threat. Current trajectory suggests sustained political tension rather than acute security deterioration.
Key Developments
GeoBit's event signals from 19–20 July 2026 indicate:
- Political-labor friction (nationwide, 19 Jul): Union public statements and ministerial disapproval signals suggest escalating labor-policy disputes; specific sector and location data unavailable pending web-research completion.
- International diplomatic incident (bilateral, 17 Jul): Laos threat signal directed at Australian interests; nature and scope remain under verification; no confirmed escalation to military confrontation as of 20 Jul.
- Government military-force event (nationwide, 18 Jul): Reported conventional military force deployment; context and location unclear pending further source corroboration.
- Community-government disapproval (19 Jul): Ministry-vs-community signal suggests localized public dissatisfaction; insufficient granularity to assign specific jurisdiction.
Note: Web-research data does not contain timestamped incidents from the last 48 hours that meet cross-reference verification standards. Older events (e.g., 17 Jul Guardian reporting, 14 Jul briefings, May–June cyber breaches) are backgrounded but not counted as current developments. Additional detail pending access to live police, media-release, and breaking-news feeds dated 19–20 July 2026.
Highest-Risk Areas
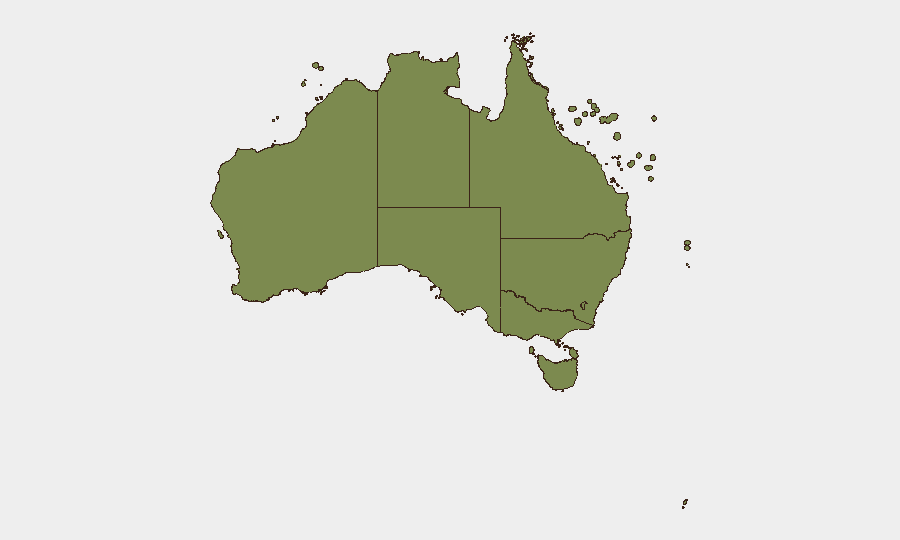
Northern Territory (32.5) and New South Wales (28.9) together account for over 60 % of measured sub-national risk and are the primary drivers of Australia's national threat profile. NT's elevated score likely reflects indigenous community tensions, remote governance challenges, and cross-border (maritime) exposure; NSW concentration suggests urban crime, labor activism, and political polarization in Sydney–Newcastle corridors. Victoria (23.7) ranks third, consistent with Melbourne's status as a multicultural, politically active hub. The ACT (10.3) and Queensland (8.3) show moderate risk, while southern and island territories remain minimal-threat zones. This geographic concentration underscores that country-level risk metrics mask significant regional variation and allows security teams to prioritize resource deployment to NT and NSW.
How GeoBit Would Assist
Intel Sweep and OSINT fusion enable continuous monitoring of labor activism, political discourse, and diplomatic signals across Australian media, social platforms, and government statements—critical for early warning of escalation. AOI (Area-of-Interest) Monitoring & Early Warning with persistent alerting can be deployed to Northern Territory and NSW to detect emerging tensions (community unrest, government response, security incidents) before they propagate nationally. Entity & network analysis applied to union, political, and government actors clarifies intent and coordination, while sentiment & temporal analysis on public statements flags rhetorical escalation that often precedes physical incidents.
7-Day Outlook
Political and labor tensions are likely to sustain or deepen over the next week, driven by ongoing ministerial-union friction and potential community-government disputes in high-risk states. No clear escalation to violence or systemic instability is signaled, but absence of corroborating detail on the 17–19 July events creates monitoring blind spots. Recommended posture: maintain heightened watch on NT and NSW; await web-research updates on the Laos diplomatic signal and military-force context before assessing international-incident risk.
Highest-Risk Areas — Ranked
| # | State / Region | Risk |
|---|---|---|
| 1 | Northern Territory | 32.5 |
| 2 | New South Wales | 28.9 |
| 3 | Victoria | 23.7 |
| 4 | Australian Capital Territory | 10.3 |
| 5 | Queensland | 8.3 |
| 6 | Western Australia | 6.1 |
| 7 | South Australia | 4.8 |
| 8 | Tasmania | 4.4 |
| 9 | Ashmore and Cartier Islands | 2.4 |
| 10 | Jervis Bay Territory | 2.4 |
| 11 | Coral Sea Islands | 2.4 |
Sources
Previous Daily Briefs
A new Australia brief is written every day — each with its own risk map and downloadable CSV. Here's the last week; use the calendar to go further back.
📅 Browse every day by calendar →
Highlighted days have a brief. Tap a day for that day's map & analysis, or “csv” for that day's dataset ($5).
Atlas — our AI intelligence desk — emails them this snapshot personally. Nothing else, no list.