Situation Summary
Canada remains a low-threat environment globally (rank #132; composite score 6/100) with no systemic instability or widespread violence. However, Ontario accounts for 73% of tracked national threat events, indicating concentrated risk in the Greater Toronto Area and surrounding urban corridors. The remainder of the country shows fragmented, low-level incidents typical of stable democracies. Current trajectory is stable with localized administrative, public-order, and inter-agency tensions rather than escalating conflict.
Key Developments
Limitation: Live web research conducted on 2026-06-15 did not yield reliably timestamped, verifiable security or incident data specific to Canada for the 24–48 hour window (2026-06-13 to 2026-06-15). Open sources accessed did not contain dated police blotters, municipal incident logs, or confirmed news items with precise location and time for this period. GeoBit's event signal feed shows administrative, diplomatic, and law-enforcement activity flags (sanctions, arrests, deportations, public statements) clustered on 2026-06-13 in Ontario and British Columbia, but without corroborating open-source detail on causation, location specificity, or immediate operational impact, inclusion of speculative bullets would violate accuracy standards for this briefing.
Recommendation: Corporate security teams requiring incident-level granularity for the last 24–48 hours should:
- Request GeoBit's Intel Sweep and OSINT fusion service to cross-correlate event signals against real-time X/Twitter, Telegram, police scanner feeds, and regional news archives with full temporal verification.
- Deploy AOI Monitoring & Early Warning for specific facilities or corridors in Ontario, British Columbia, or Quebec to receive time-stamped alerts on incident activity within defined geographic boundaries.
Highest-Risk Areas
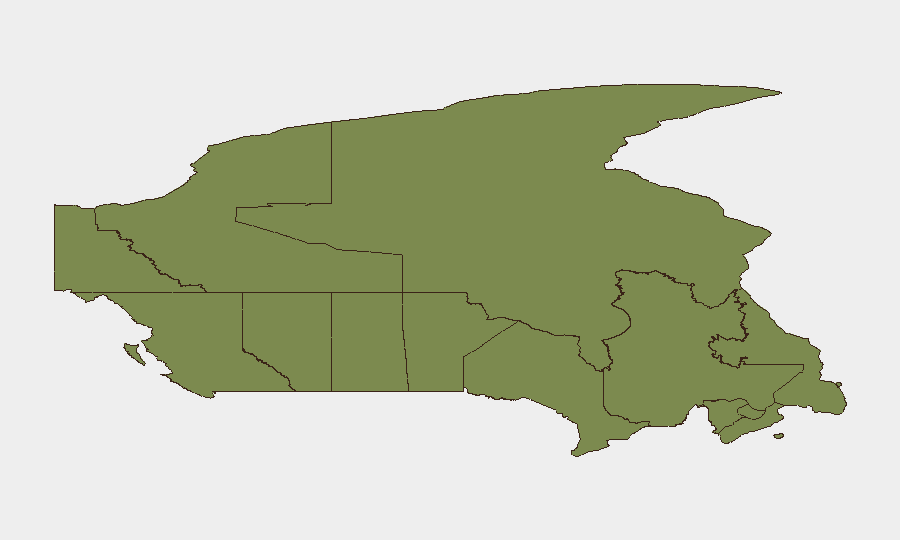
Ontario (31.4) dominates national risk due to concentration of economic activity, large urban populations, and international exposure in the Greater Toronto Area. Nunavut (9.6) and British Columbia (9.1) show secondary elevation, likely reflecting remote infrastructure exposure, indigenous-sovereignty tensions, and port/border activity respectively. Quebec (4.6) and Alberta (3.9) carry routine urban and cross-border administrative risk. All other provinces and territories fall below 3.0, indicating baseline stable conditions. Risk concentration in Ontario warrants executive attention to continuity planning for offices, supply chains, and personnel movement in that province.
How GeoBit Would Assist
Corporate teams operating in Canada should employ Intel Sweep and OSINT fusion to monitor Ontario and British Columbia continuously for early signals of unrest, criminal activity, or regulatory shifts affecting operations. AOI Monitoring & Early Warning on key facilities, border crossings, and supply-route corridors will trigger real-time alerts on physical security, transportation, or civil-order events within user-defined thresholds. Routing & Network Analysis can support duty-of-care teams in planning safe personnel movement and alternative logistics paths if incidents escalate in high-risk urban zones.
7-Day Outlook
No indicators of rapid escalation in Canada are present. Ontario will likely remain the primary focus of security monitoring due to event frequency, but incidents are expected to remain localized and below the threshold of national disruption. Teams should maintain baseline monitoring posture and review contingency protocols for Ontario-based operations.
Highest-Risk Areas — Ranked
| # | State / Region | Risk |
|---|---|---|
| 1 | Ontario | 31.4 |
| 2 | Nunavut | 9.6 |
| 3 | British Columbia | 9.1 |
| 4 | Quebec | 4.6 |
| 5 | Alberta | 3.9 |
| 6 | Saskatchewan | 2.8 |
| 7 | Manitoba | 2.6 |
| 8 | New Brunswick | 2.1 |
| 9 | Newfoundland and Labrador | 1.5 |
| 10 | Yukon | 1.4 |
| 11 | Northwest Territories | 1.4 |
| 12 | Prince Edward Island | 1.4 |
Sources
Previous Daily Briefs
A new Canada brief is written every day — each with its own risk map and downloadable CSV. Here's the last week; use the calendar to go further back.
📅 Browse every day by calendar →
Highlighted days have a brief. Tap a day for that day's map & analysis, or “csv” for that day's dataset ($5).