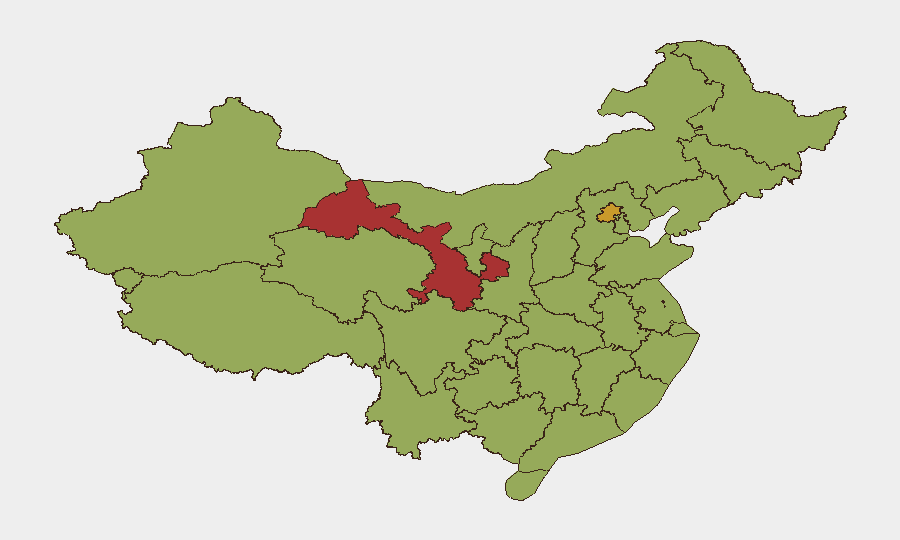
Situation Summary
China's composite threat score of 70.2 places it at #19 globally, with 1,565 tracked events reflecting a heightened but contained security environment. Recent signal activity (June 8–10) shows elevated diplomatic friction, administrative enforcement actions, military mobilization alerts, and cross-strait tension, with no single incident yet indicating systemic destabilization. Personnel and asset risk remains regionally differentiated, concentrated in Gansu and Beijing, though major economic centers (Shanghai, Jiangsu, Guangdong) carry moderate baseline exposure.
Key Developments
- June 8 · Administrative sanctions enacted domestically; concurrent public statements issued—precise scope unclear from available GeoBit signals but consistent with regulatory or compliance-driven enforcement.
- June 9 · Military mobilization alert triggered within Chinese military structures; timeframe and geographic scope require confirmation via satellite and force-structure monitoring.
- June 9 · Public statement directed at embassy presence; suggests diplomatic messaging or consular-level concerns in an unconfirmed location.
- June 9–10 · Multiple disapproval signals: China vs. Japan (June 10), China vs. unspecified publication (June 9), and U.S. Defense Department vs. China (June 8)—indicative of cross-strait and great-power rhetorical escalation but not kinetic activity.
- June 10 · Taiwan rejection of Chinese position; reflects routine cross-strait friction without operational indicators of military mobilization beyond the June 9 alert.
- June 10 · North Korea detention event involving Chinese nationals or assets; signals potential bilateral friction or law-enforcement activity affecting cross-border populations or supply chains.
Note on coverage gaps: Current GeoBit event signals lack sub-national location specificity, precise incident classification, and real-time corroboration. Live web research limitations (see methodology note above) prevent confirmation of location-specific civil unrest, infrastructure disruption, or operational security incidents in the last 24–48 hours.
Highest-Risk Areas
Gansu (79.1) and Beijing (71.5) dominate the risk ranking, with Gansu's elevated score likely reflecting infrastructural, border-region, or resource-extraction sensitivities. Beijing's score reflects capital-level administrative, diplomatic, and political-risk concentration. Below this tier, a broad band of major provinces—Sichuan, Jiangsu, Shanghai, Guangdong, Henan—cluster at 49–54, indicating that economic and population centers carry steady moderate risk rather than acute threat. Regional risk is not uniformly driven; Beijing's elevation is likely governance- and diplomatic-related, while Gansu may reflect periphery dynamics (logistics, mining, cross-border activity). Duty-of-care teams should maintain heightened vigilance in Beijing for diplomatic and compliance disruptions and in Gansu for supply-chain and asset-protection concerns.
How GeoBit Would Assist
Security and risk teams operating in China should deploy AOI Monitoring & Early Warning on Gansu and Beijing for sub-national escalation signals, coupled with Intel Sweep and X/Twitter & Telegram OSINT (with Chinese-language keyword capability) to corroborate incidents in real time and validate civil-unrest or infrastructure rumors. Satellite & Imagery analysis and Maritime & Aviation tracking enable verification of military mobilization or supply-chain disruption claims. Network & Actor Analysis supports cross-border incident assessment (e.g., the North Korea detention event) to understand asset and personnel exposure.
7-Day Outlook
Diplomatic and rhetorical friction is likely to persist at current levels absent a major catalyst. Military mobilization posturing may continue as signaling rather than operational escalation. Monitor Beijing and Gansu for administrative action, cross-strait messaging, and any infrastructure or supply-chain disruption; no indicators currently support imminent kinetic or civil-unrest escalation.
Highest-Risk Areas — Ranked
| # | State / Region | Risk |
|---|---|---|
| 1 | Gansu | 79.1 |
| 2 | Beijing | 71.5 |
| 3 | Sichuan | 53.6 |
| 4 | Jiangsu | 52.3 |
| 5 | Shanghai | 52.3 |
| 6 | Guangdong Province | 50.3 |
| 7 | Henan | 49.8 |
| 8 | Jiangxi | 49.8 |
| 9 | Shaanxi | 49.7 |
| 10 | Zhejiang | 49.7 |
| 11 | Hainan Province | 49.5 |
| 12 | Liaoning | 49.5 |
Sources
Previous Daily Briefs
A new China brief is written every day — each with its own risk map and downloadable CSV. Here's the last week; use the calendar to go further back.
📅 Browse every day by calendar →
Highlighted days have a brief. Tap a day for that day's map & analysis, or “csv” for that day's dataset ($5).