Situation Summary
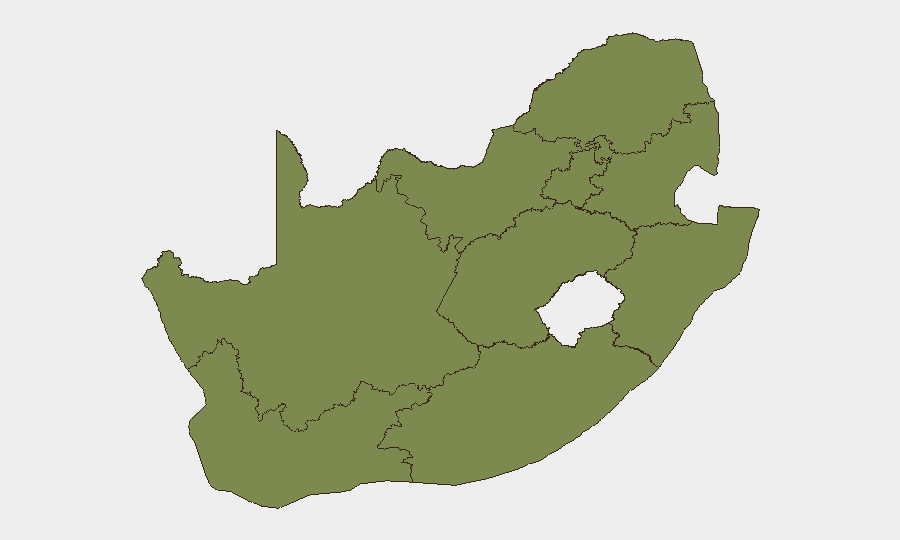
South Africa remains in the mid-range of global security concern (rank #66, composite score 19), with 1,587 tracked events. Gauteng province—home to Johannesburg and Pretoria—dominates the risk profile at 2.7× the national average, driven by urban crime, protest activity, and organized violence. The security environment is fragmented by geography: Gauteng, Free State, and North West account for the majority of tracked incident volume, while coastal and northern provinces show substantially lower threat density. Current institutional focus on the Madlanga Commission hearings (witness safety and governance accountability) reflects underlying tensions around state capacity and public confidence.
Key Developments
Institutional Security Coordination – Pretoria, 30 June 2026
South African Police Service (SAPS) convened a media briefing at the National Joint Operational and Intelligence Structure (NATJOINTS) centre regarding witness safety protocols at the Madlanga Commission, indicating ongoing coordination on high-profile security and judicial matters.
Madlanga Commission Hearings – National, 1 July 2026
Live proceedings commenced, focused on security governance and institutional accountability, with YouTube livestream coverage suggesting elevated public and media attention to state legitimacy and witness protection frameworks.
Note on Limited Recent Incident Data
Web research conducted over the last 24–48 hours has not yielded time-stamped, corroborated discrete incidents (e.g., specific attacks, arrests, or infrastructure failures) dated 29–30 June 2026. Ongoing arrest operations related to looting are documented in national reporting, but specific timing and location data are not available in current open sources. This suggests either low reported incident density or lag in public reporting—both merit monitoring.
Highest-Risk Areas
Gauteng's composite risk score of 32.5 places it as South Africa's dominant threat hotspot, reflecting high concentrations of organized crime, service-delivery protests, and gang violence in metropolitan Johannesburg and Pretoria. Free State (18.0) and North West (16.2) follow, likely driven by mining-related labor disputes, illicit economy activity, and weak state presence in peripheral areas. KwaZulu-Natal, Eastern Cape, and remaining provinces show substantially lower scores, indicating either lower incident frequency or more effective local security management. The geographic concentration suggests that corporate and diplomatic security resources should be weighted heavily toward Gauteng, with secondary focus on Free State and North West.
How GeoBit Would Assist
Area-of-Interest Monitoring & Early Warning would provide persistent watch on Gauteng's hotspots (Johannesburg CBD, Alexandra, Pretoria administrative zones) with real-time alerting for protest mobilization, violence escalation, or infrastructure disruption. Intel Sweep and multi-source OSINT fusion (X, Telegram, local news, SIGINT) would deliver 24–48 hour early warning of emerging incidents or organized activity before they impact operations. GIS & Spatial Analysis combined with Network & Actor Analysis would map crime and protest networks, enabling security teams to identify safe corridors, avoid flashpoints, and route personnel and assets dynamically.
7-Day Outlook
The Madlanga Commission's active hearings will likely sustain institutional focus on governance and accountability, potentially triggering secondary protest activity or political rhetoric. Gauteng's baseline threat level shows no indicators of acute near-term escalation, though service-delivery grievances and ongoing organized crime remain persistent drivers. Security teams should maintain standard posture while monitoring for sudden shifts in protest messaging or law-enforcement operations that could disrupt movement and business continuity.
Highest-Risk Areas — Ranked
| # | State / Region | Risk |
|---|---|---|
| 1 | Gauteng | 32.5 |
| 2 | Free State | 18 |
| 3 | North West | 16.2 |
| 4 | Eastern Cape | 16 |
| 5 | KwaZulu-Natal | 6 |
| 6 | Limpopo | 3.5 |
| 7 | Northern Cape | 3.2 |
| 8 | Western Cape | 2.4 |
| 9 | Mpumalanga | 2.4 |
Previous Daily Briefs
A new South Africa brief is written every day — each with its own risk map and downloadable CSV. Here's the last week; use the calendar to go further back.
📅 Browse every day by calendar →
Highlighted days have a brief. Tap a day for that day's map & analysis, or “csv” for that day's dataset ($5).