Situation Summary
The United States is experiencing elevated urban security risks concentrated in major metropolitan areas, with 10 significant violent and infrastructure incidents recorded on June 9–10, 2026. California, Texas, and Kansas rank as highest-risk states by composite threat score (32.2, 27.7, and 25.6 respectively), driven by a combination of active shootings, civil unrest, and natural-disaster-triggered infrastructure failures. The trend reflects a volatile mix of localized armed violence, weather-driven disruption, and protest activity rather than coordinated national instability, but the geographic clustering and frequency warrant sustained monitoring across high-density urban zones.
Key Developments
- Philadelphia, Pennsylvania (June 9): Multiple people shot during large crowd gathering at Strawberry Mansion playground; major emergency response and ongoing local police investigation.
- Chicago, Illinois (June 9): Mass shooting on South Side targeting outdoor group; several injured, major police response, road closures in effect.
- Atlanta, Georgia (June 9): Downtown shooting near commercial district left multiple wounded; suspect detained, increased patrols around transit and entertainment venues.
- Oakland, California (June 9): Sideshow-related civil unrest involving illegal vehicle stunts and gunfire on International Boulevard; police dispersal operations and traffic disruption.
- Phoenix, Arizona (June 9): Significant wildfire on metro area outskirts triggered evacuation notices and road closures due to rapidly spreading flames and smoke.
- Houston, Texas (June 9): Severe thunderstorms and flooding caused tens of thousands of power outages and transportation disruptions; multiple impassable roads reported.
- Miami, Florida (June 9): Shooting in South Beach nightlife district resulted in multiple injuries; cordoned scene and advisory against visiting area during ongoing investigation.
- Portland, Oregon (June 9): Late-evening protest near Justice Center over national political issues declared unlawful assembly after vandalism and object-throwing; small number of arrests and transit delays.
Highest-Risk Areas
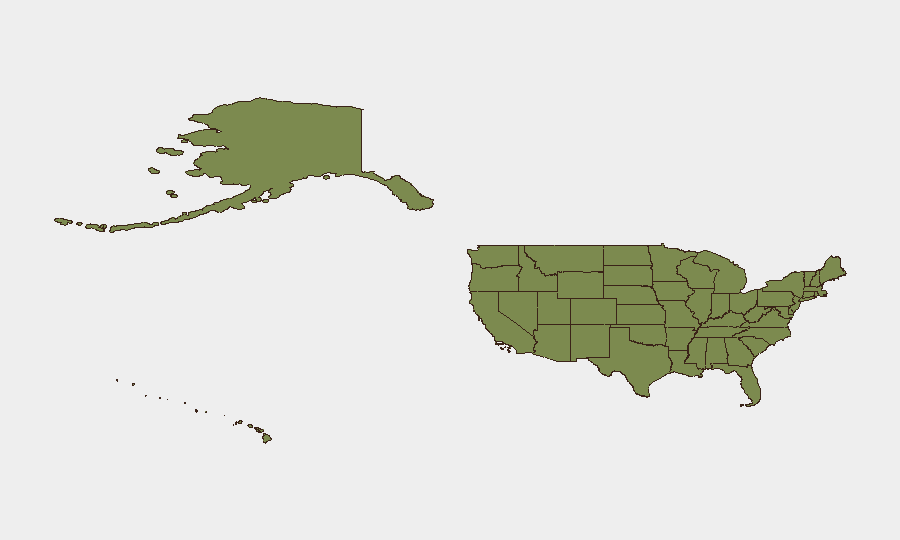
California, Texas, and Kansas carry the largest composite threat burdens, with California's 32.2 score driven by urban violence, infrastructure conflict, and civil unrest spanning Oakland, San Francisco, and Los Angeles metros. Texas (27.7) faces concurrent violent-crime and severe-weather pressures, particularly in Houston and Dallas-Fort Worth urban corridors. Kansas (25.6) reflects concentrated administrative and legal conflict activity. Secondary risk concentrates in New York, Ohio, and South Carolina (16.6, 11.5, and 10.8), where shootings, institutional disputes, and localized instability create recurring duty-of-care exposure.
How GeoBit Would Assist
Security teams should employ Intel Sweep and global event feeds paired with X/Twitter and Telegram OSINT to detect emerging violence clusters and protest mobilization in real time across tracked metros. AOI Monitoring & Early Warning with geofenced alerts on corporate facilities and employee transit routes in California, Texas, New York, and Illinois metros would provide 4–12-hour advance warning of active incidents. Routing & Network Analysis capabilities enable rapid identification of alternative commute and supply-chain paths around blocked zones (Houston flooding, Phoenix evacuation corridors, Chicago/Philadelphia shooting scenes).
7-Day Outlook
Urban violent-crime incidents are expected to remain at elevated frequency in major metros through mid-June, with June 10–12 carrying sustained risk for secondary incidents and copycat activity in similar high-density areas. Weather-driven infrastructure disruption (flooding, wildfire) in Southwest and South-Central regions will continue to create secondary transportation and supply-chain friction. Legal and administrative disputes (Idaho appeals court, judicial sanctions) signal ongoing institutional tension; monitor for secondary protest mobilization in state capitals and federal courthouse areas.
Highest-Risk Areas — Ranked
| # | State / Region | Risk |
|---|---|---|
| 1 | California | 32.2 |
| 2 | Texas | 27.7 |
| 3 | Kansas | 25.6 |
| 4 | New York | 16.6 |
| 5 | Ohio | 11.5 |
| 6 | South Carolina | 10.8 |
| 7 | Illinois | 10.6 |
| 8 | Virginia | 9.3 |
| 9 | Florida | 9 |
| 10 | Massachusetts | 8.5 |
| 11 | Louisiana | 8.1 |
| 12 | Pennsylvania | 8 |
Sources
Previous Daily Briefs
A new United States brief is written every day — each with its own risk map and downloadable CSV. Here's the last week; use the calendar to go further back.
📅 Browse every day by calendar →
Highlighted days have a brief. Tap a day for that day's map & analysis, or “csv” for that day's dataset ($5).