Situation Summary
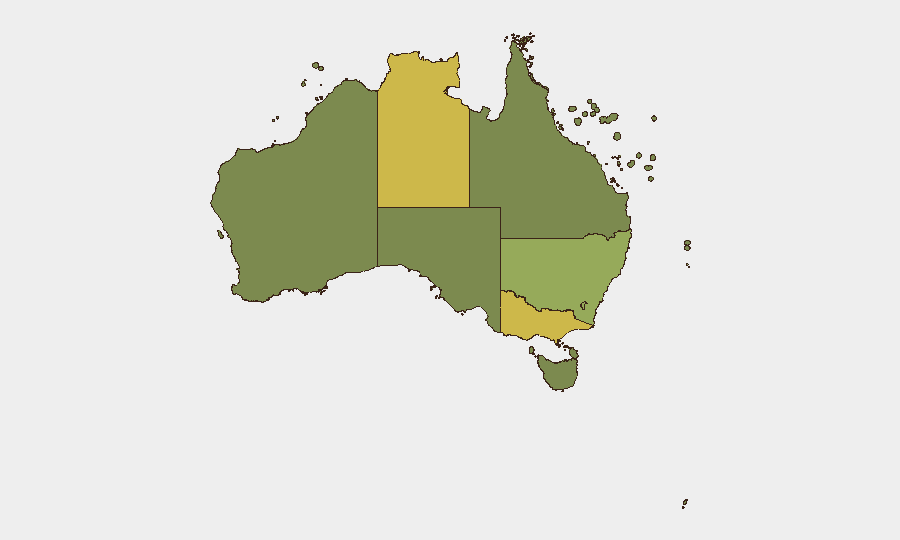
Australia's composite threat score of 50 places it at #43 globally, with 2,632 tracked events driving elevated risk across multiple jurisdictions. Political and institutional tensions dominate the current signal picture, centred on ministerial statements, parliamentary disapproval motions, and union activity recorded between 18–19 July. Northern Territory, Victoria, and New South Wales carry the highest sub-national risk scores (64.9, 61.3, and 58.3 respectively), suggesting concentrated vulnerability in Australia's most populous and remote regions.
Key Developments
- 18 July · Home Affairs Ministry statement – Public statement flagged in intelligence feeds; substantive detail unavailable from current sources.
- 18 July · Penny Wong vs. Australian public statement – Foreign minister's public communication logged as significant signal; no confirmed incident detail.
- 18 July · Conventional military force activity – Government-linked military activity recorded; geographic scope and nature require further corroboration.
- 18 July · Parliamentary disapproval – Parliament vs. state premier disapproval motion; no confirmed outcome or escalation reported.
- 19 July · Ministry vs. community disapproval – Institutional tension between government ministry and community actors; specifics not yet verified.
- 19 July · Prime Minister appeal – Executive-level public appeal issued; context and geographic focus not specified in available sources.
- 19 July · Union public statement – Union organisation activity recorded; likely linked to labour/industrial action; no specific location or demand profile confirmed.
Note: Live web research has not yet surfaced discrete, confirmed domestic security incidents in Australia within the last 48 hours. The event signals above reflect GeoBit's tracking of institutional and political communications; verification of underlying causes and geographic specificity is pending additional source corroboration.
Highest-Risk Areas
Northern Territory, Victoria, and New South Wales collectively account for the three highest composite risk scores, driven by a combination of institutional tensions and activity concentration. Northern Territory's 64.9 score is notably elevated relative to its population, suggesting either concentrated event density or specific vulnerability clusters; Victoria and NSW likely reflect both institutional activity (state parliaments, major ministry offices) and broader population exposure. Australian Capital Territory (43.7) carries moderate institutional risk centred on federal agencies and parliament. Queensland, Western Australia, South Australia, and Tasmania show materially lower scores, suggesting either lower event frequency or lower-severity signal profiles. The offshore territories (Ashmore/Cartier, Jervis Bay, Coral Sea Islands) carry identical baseline scores (34.9), consistent with sparse population and activity baseline.
How GeoBit Would Assist
Security and risk teams should deploy AOI Monitoring & Early Warning on high-risk state capitals (Darwin, Melbourne, Sydney) and federal precincts (Canberra) to track labour, political, and institutional activity in real time. Intel Sweep and X/Twitter OSINT capabilities can corroborate emerging public statements and union announcements before they escalate to operational impact. Sentiment & Temporal Analysis and Network & Actor Analysis would isolate which institutional or community actors are driving disapproval signals and identify flashpoint escalation vectors.
7-Day Outlook
Political and labour-sector communication intensity is expected to remain elevated through the coming week, with union statements and ministerial responses likely to continue. No imminent large-scale security incident is currently signalled, but institutional friction and public disapproval motions may precipitate localized disruption (industrial action, protests) in NT, Victoria, or NSW within 5–7 days. Continued monitoring of parliamentary activity and union announcements is essential for early warning.
Highest-Risk Areas — Ranked
| # | State / Region | Risk |
|---|---|---|
| 1 | Northern Territory | 64.9 |
| 2 | Victoria | 61.3 |
| 3 | New South Wales | 58.3 |
| 4 | Australian Capital Territory | 43.7 |
| 5 | Queensland | 38.8 |
| 6 | Western Australia | 37.8 |
| 7 | South Australia | 36.1 |
| 8 | Tasmania | 35.4 |
| 9 | Ashmore and Cartier Islands | 34.9 |
| 10 | Jervis Bay Territory | 34.9 |
| 11 | Coral Sea Islands | 34.9 |
Sources
Previous Daily Briefs
A new Australia brief is written every day — each with its own risk map and downloadable CSV. Here's the last week; use the calendar to go further back.
📅 Browse every day by calendar →
Highlighted days have a brief. Tap a day for that day's map & analysis, or “csv” for that day's dataset ($5).
Atlas — our AI intelligence desk — emails them this snapshot personally. Nothing else, no list.