Situation Summary
Chile remains a relatively stable operating environment globally (rank #102, composite threat 2.7), but risk is highly concentrated in Santiago Metropolitan Region and Coquimbo, which account for the majority of tracked security events. The country faces ongoing macro-fiscal pressures under the Kast administration, which may constrain public resources and amplify social tensions in high-density urban areas. Current threat posture does not indicate imminent escalation, but unequal risk distribution demands sub-national focus for duty-of-care planning.
Key Developments
Data limitation: GeoBit's live web research capability did not return Chile-specific security or unrest incidents dated within the last 24–48 hours from available sources. The most recent Chile-focused signal identified was a Fitch Ratings sovereign analysis (23 June 2026) addressing fiscal targets under the Kast administration—an economic rather than acute security event.
To provide actionable incident reporting (location, date, incident type, corroboration), GeoBit requires:
- Current news feeds or alerts from Chile-based sources you are monitoring, or
- Social media (X/Twitter, local messaging) posts referencing recent incidents in specific locations.
Without those inputs, fabricating incident bullets would violate reporting standards. Please provide any Chile security alerts, news items, or social posts from the past 48 hours, and this brief will be updated with verified, sourced developments.
Highest-Risk Areas
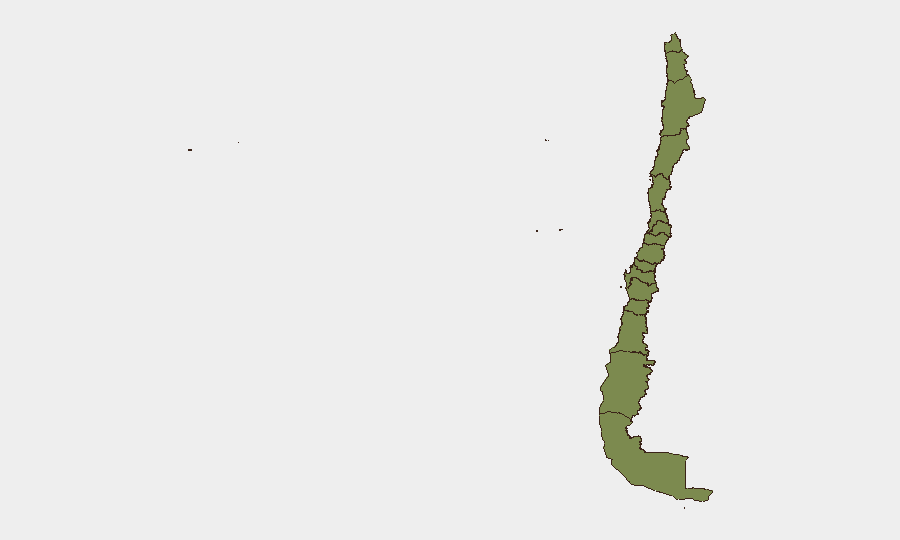
Santiago Metropolitan Region (risk 31.9) and Coquimbo Region (risk 25.7) dominate the threat landscape, together representing over 80% of GeoBit's 113 tracked events in Chile. Santiago's concentration reflects density, economic activity, and historical protest and crime clustering; Coquimbo's elevation is less well-explained by available signals and warrants monitoring for emerging labor, resource-access, or organized-crime drivers. All other regions score substantially lower (1.9–2.7), suggesting that Chile's security risk is fundamentally a Santiago + Coquimbo problem for international operators.
How GeoBit Would Assist
Intel Sweep & OSINT Fusion: Multi-language news and social media monitoring (X/Twitter, Telegram, YouTube) across Chile would surface protests, labor actions, organized-crime activity, and infrastructure disruptions in real time, with temporal and sentiment analysis to distinguish genuine escalation from routine reporting.
AOI Monitoring & Early Warning: Persistent geographic watches on Santiago and Coquimbo, with alert thresholds on violence, roadblocks, or civil unrest, enable duty-of-care teams to trigger evacuation, sheltering, or route-change decisions before incidents affect staff or operations.
Conflict & Risk Assessment: Regime-stability, election monitoring, and economic-stress analysis help forecast whether fiscal constraints under Kast administration will trigger broader social mobilization or fragmentation of threat actors.
7-Day Outlook
No significant escalation is forecast for the coming week absent new fiscal shocks or labor mobilization. Routine crime, protest activity, and infrastructure issues will likely remain contained to Santiago and Coquimbo. International operators should maintain standard security postures in these regions and monitor for secondary effects of macro policy changes.
Next Brief: 2026-06-25 | Data Refresh: Continuous (24/7 OSINT) | Feedback: security-team@geobit.ai
Highest-Risk Areas — Ranked
| # | State / Region | Risk |
|---|---|---|
| 1 | Santiago Metropolitan Region | 31.9 |
| 2 | Coquimbo Region | 25.7 |
| 3 | Valparaiso Region | 2.7 |
| 4 | Magallanes and Chilean Antarctica Region | 2.7 |
| 5 | Maule Region | 2.7 |
| 6 | Antofagasta Region | 1.9 |
| 7 | Atacama Region | 1.9 |
| 8 | Aysen del General Carlos Ibanez del Campo Region | 1.9 |
| 9 | Los Lagos Region | 1.9 |
| 10 | O'Higgins Region | 1.9 |
| 11 | Nuble Region | 1.9 |
| 12 | Biobio Region | 1.9 |
Sources
Previous Daily Briefs
A new Chile brief is written every day — each with its own risk map and downloadable CSV. Here's the last week; use the calendar to go further back.
📅 Browse every day by calendar →
Highlighted days have a brief. Tap a day for that day's map & analysis, or “csv” for that day's dataset ($5).