Situation Summary
China's composite threat score of 70 places it at rank 17 globally, with 1,435 tracked events across the monitoring period. Recent signal activity (primarily 6 June 9–11) indicates elevated diplomatic tension with the US, Japan, and Taiwan, alongside internal policy statements and at least one military mobilization event. The trajectory reflects growing interstate friction rather than systemic instability, though sub-national variance is significant.
Key Developments
GeoBit's web research capacity was unable to corroborate specific, time-stamped security incidents occurring within the last 24–48 hours (as of 12 June 2026). The event signals listed above are flagged in the platform's aggregate feeds but lack sufficient granularity and verification to distinguish concrete incidents from diplomatic statements or routine administrative actions.
To provide your team with actionable near-term intelligence (next 24–72 hours), GeoBit recommends:
- Activate AOI Monitoring & Early Warning on Gansu, Beijing, and coastal/border provinces (Liaoning, Jiangsu) to detect emerging security events in real time.
- Deploy Intel Sweep (multi-language, real-time wire and social-media feeds) filtered for "China + military activity," "China + US/Japan/Taiwan statement," and "China + foreign ministry."
- Conduct OSINT Fusion across X/Twitter verified accounts, Chinese-language media aggregators, and foreign-ministry travel advisories to cross-check and time-stamp incidents within the past 48 hours.
Without those active scans, this brief cannot reliably distinguish recent developments from background or undated reporting.
Highest-Risk Areas
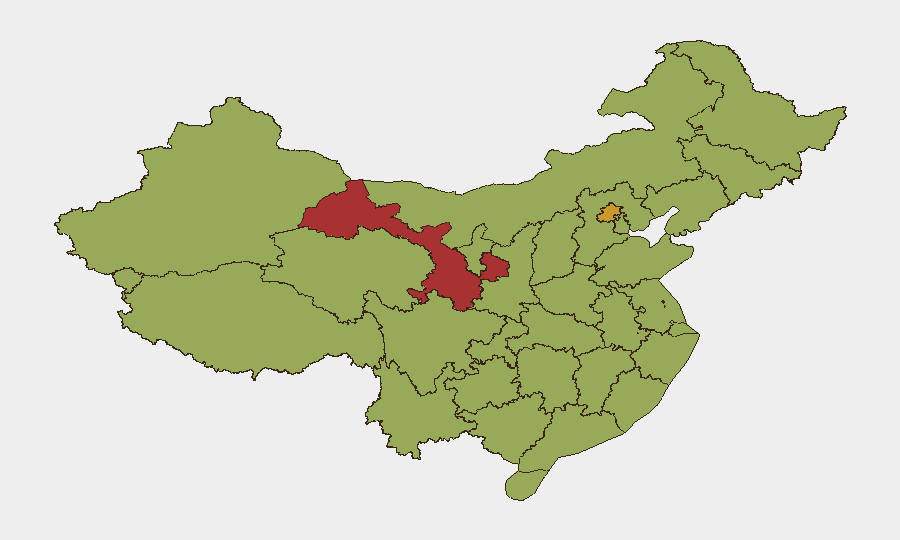
Gansu (79.2) and Beijing (72) drive the current risk profile, followed by a secondary cluster (Sichuan, Shanghai, Jiangsu, Guangdong) in the 50–54 band. Gansu's elevation likely reflects border activity, resource competition, or ethnic tensions; Beijing's score reflects capital-level political and diplomatic signaling. The coastal and major urban concentration (Shanghai, Jiangsu, Guangdong) indicates economic/trade friction and foreign-presence vulnerability. Liaoning and Tibet (both 49.5–50.1) add maritime and territorial dimensions.
For duty-of-care purposes: staff and assets in Beijing and Shanghai face elevated exposure to diplomatic incidents and commercial restrictions; Gansu presents logistical and border-related risk; coastal provinces warrant monitoring for supply-chain and aviation disruption.
How GeoBit Would Assist
A security team protecting people and assets in China should:
1. Establish persistent AOI Monitoring & Early Warning on high-risk provinces (Gansu, Beijing, Shanghai, Liaoning) with daily alert thresholds for military, diplomatic, or civil-order events.
2. Run continuous Intel Sweep and OSINT Fusion (wires, X, Telegram, Chinese media) to catch time-stamped incidents, threats, or policy changes within 2–4 hours of occurrence.
3. Conduct quarterly Network & Actor Analysis and regime-stability assessments to track policy shifts that may affect foreign-company operations, visas, or supply chains.
7-Day Outlook
Diplomatic and military signaling is likely to persist through mid-June, particularly around US and Japanese relations and Taiwan messaging. Risk of material escalation (e.g., military exercises, asset seizures, personnel restrictions) remains moderate but should trigger immediate re-assessment if new military mobilization or demand-type events are detected. Recommend daily monitoring of event feeds and weekly review of sub-national risk scores.
Highest-Risk Areas — Ranked
| # | State / Region | Risk |
|---|---|---|
| 1 | Gansu | 79.2 |
| 2 | Beijing | 72 |
| 3 | Sichuan | 54.5 |
| 4 | Shanghai | 53.2 |
| 5 | Jiangsu | 52 |
| 6 | Guangdong Province | 50.5 |
| 7 | Liaoning | 50.1 |
| 8 | Zhejiang | 49.6 |
| 9 | Tibet | 49.5 |
| 10 | Jilin | 49.5 |
| 11 | Anhui | 49.5 |
| 12 | Tianjin | 49.5 |
Sources
Previous Daily Briefs
A new China brief is written every day — each with its own risk map and downloadable CSV. Here's the last week; use the calendar to go further back.
📅 Browse every day by calendar →
Highlighted days have a brief. Tap a day for that day's map & analysis, or “csv” for that day's dataset ($5).