Situation Summary
Ethiopia remains the 10th-highest-threat country globally, driven primarily by ongoing civil conflict with 75 tracked events. The security environment is characterized by active armed clashes, ethnic tensions, and intercommunal violence across multiple regions, alongside concurrent disease outbreaks (Marburg virus and malaria). The conflict trajectory remains unstable with no near-term resolution indicators, and recent signals suggest ongoing investigative activity and cross-border threat dimensions.
Key Developments
Recent event signals logged in the GeoBit platform include:
- 2026-06-13 · Investigation flagged – Ethiopia-wide; nature and location of investigation not yet specified in available reporting; suggests emerging incident requiring assessment.
- 2026-06-13 · Cross-border threat signal – Africa-Ethiopia axis; indicates potential regional actor involvement or transnational dimension; specifics pending corroboration.
- Health alerts (ongoing) – Marburg virus disease and malaria cases continue to be reported across Ethiopia, compounding humanitarian and medical-access risks in conflict-affected regions.
Note: Open-source reporting accessible in the last 24–48 hours does not provide time-stamped incident logs (e.g., specific clashes, road closures, or displacement events) with sufficient cross-confirmation for inclusion as discrete developments. Standing security advisories confirm that violent crime, civil unrest, tribal clashes, kidnapping, and landmine presence remain pervasive, but these represent persistent threat categories rather than acute 24–48-hour events. Teams requiring granular incident-level reporting should employ real-time OSINT feeds and regional media monitors.
Highest-Risk Areas
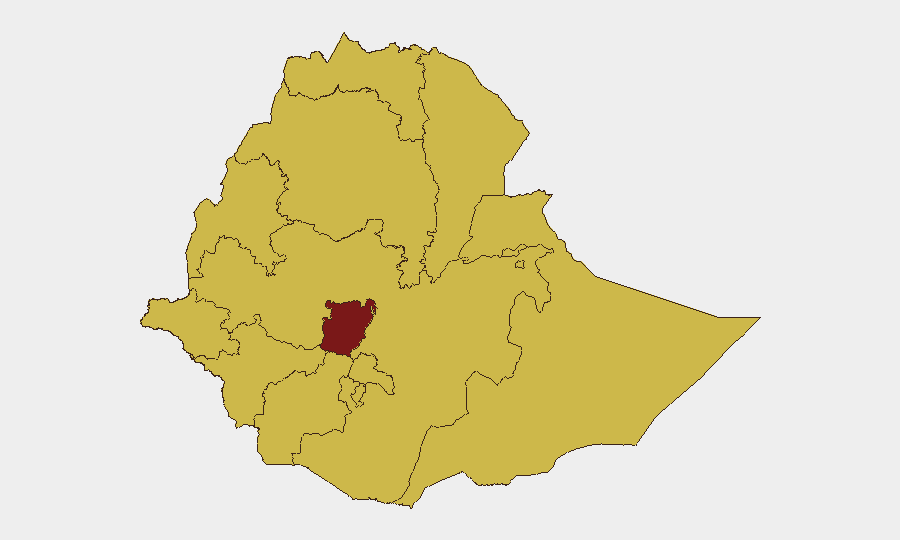
Central Ethiopia Regional State ranks as the single highest-risk sub-national area (score 100), indicating sustained conflict intensity and instability. Tigray, Amhara, Afar, Benishangul-Gumuz, Somali, Gambela, South West Ethiopia Peoples, Oromia, and Sidama all register at risk level 70, reflecting widespread armed-group activity, ethnic tensions, and limited state control. Addis Ababa, despite its capital status, also scores at 70, underscoring risks of urban crime, protest escalation, and potential secondary effects of regional conflicts. These rankings reflect prolonged civil war dynamics, contested territorial control, and communal violence rather than isolated incidents.
How GeoBit Would Assist
Security teams with personnel or assets in Ethiopia should deploy AOI Monitoring & Early Warning on high-risk regions (Central Ethiopia, Tigray, Amhara, Oromia) configured with alerting on armed clashes, displacement, and checkpoint activity. OSINT fusion (X/Twitter, Telegram, regional media, and verified Ethiopian journalists) combined with temporal and sentiment analysis will enable near-real-time incident detection and corroboration. Routing & Network Analysis can map safe corridors and alternative supply routes; conflict battle mapping will track territorial control and armed-group positions to inform duty-of-care decisions on movement and site security.
7-Day Outlook
The security picture is expected to remain volatile across Central Ethiopia, the Tigray-Amhara-Afar triangle, and Oromia over the next week. No imminent de-escalation signals are apparent; health threats (Marburg, malaria) will continue to strain medical and logistical capacity in conflict zones. Organizations should maintain heightened vigilance on the investigation flagged 2026-06-13 and cross-border threat dimensions as they develop.
Highest-Risk Areas — Ranked
| # | State / Region | Risk |
|---|---|---|
| 1 | Central Ethiopia Regional State | 100 |
| 2 | Tigray | 70 |
| 3 | Amhara Region | 70 |
| 4 | Afar Region | 70 |
| 5 | Benishangul-Gumuz Region | 70 |
| 6 | Somali Region | 70 |
| 7 | Gambela Region | 70 |
| 8 | South West Ethiopia Peoples | 70 |
| 9 | Addis Ababa | 70 |
| 10 | South Ethiopia Regional State | 70 |
| 11 | Oromia Region | 70 |
| 12 | Sidama | 70 |
Sources
Previous Daily Briefs
A new Ethiopia brief is written every day — each with its own risk map and downloadable CSV. Here's the last week; use the calendar to go further back.
📅 Browse every day by calendar →
Highlighted days have a brief. Tap a day for that day's map & analysis, or “csv” for that day's dataset ($5).