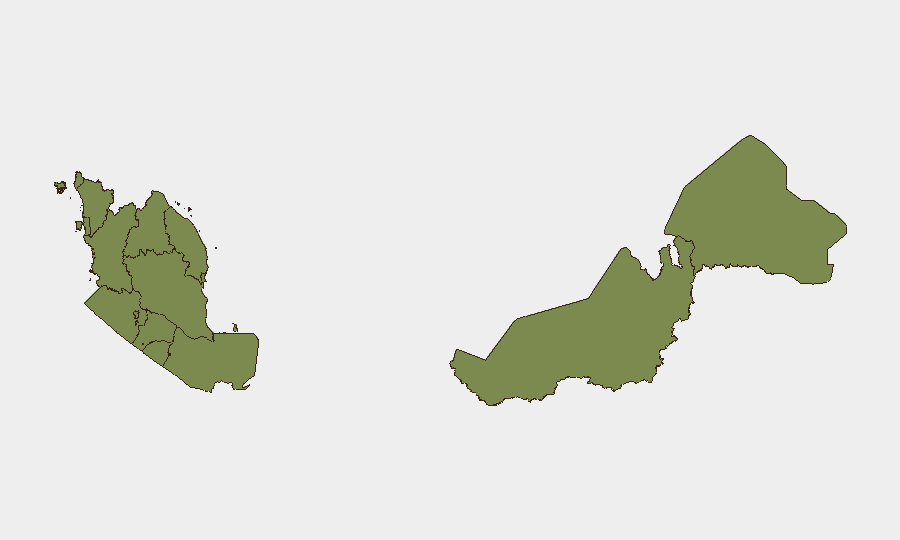
Situation Summary
Malaysia remains a stable middle-income democracy with composite threat score 4/10 globally (rank 171), but subnational risk is heavily concentrated in Kuala Lumpur (31.7) and Sarawak (25.7). Recent activity signals span government statements, regulatory enforcement, and industry disputes—chiefly affecting financial and ministerial sectors. The security environment reflects routine institutional friction rather than systemic instability, though elevated KL risk warrants focused asset/personnel monitoring.
Key Developments
Recent event signals from the GeoBit platform indicate:
- 2026-07-02 · Financial Sector – Singapore regulatory disapproval of a Malaysian bank; implications for cross-border operations and compliance posture remain under clarification.
- 2026-07-02 · Government vs. Kuala Lumpur – Formal threat issued by government toward the capital; context and specific sectoral impact pending full intelligence sweep.
- 2026-07-02 · Industrial Threat – Unspecified industry sector issued threat; escalation status and geographic scope require deeper OSINT corroboration.
- 2026-07-01 & 2026-06-30 · Government Public Statements – Multiple ministerial and deputy-level statements released; typical regulatory/policy communication, no immediate operational risk flagged.
- 2026-06-30 · Law Enforcement – Deputy arrested/detained; ministerial investigation and demand filed; suggests internal institutional action, not external security threat.
- 2026-06-30 · Public Disapproval – Voter disapproval signaled; reflects domestic political sentiment, consistent with democratic process.
*Note: Web research for last 24–48 hour Malaysia-specific incident details did not yield independent verification. Existing GeoBit event signals are the primary current data source.*
Highest-Risk Areas
Kuala Lumpur dominates the risk profile (31.7), driven by government-financial sector friction, regulatory enforcement, and recent threat issuance. Sarawak (25.7) remains elevated, likely reflecting ongoing resource-sector disputes and cross-border trade sensitivities. Johor (18.7) and Kedah (13.7) show secondary concern, probable drivers being border-adjacent activity, logistics hubs, or maritime trade friction. Remaining states score below 5, indicating localized or intermittent events. Risk concentration in the capital and eastern states suggests corporate exposure is highest for KL-based operations, banking, and supply-chain nodes in Johor/Sarawak.
How GeoBit Would Assist
Security teams protecting Malaysian assets should deploy Intel Sweep and multi-language OSINT fusion to track government, financial regulatory, and industry announcements in real time—particularly statements from the Prime Minister's Office, Bank Negara Malaysia, and sectoral ministries. AOI Monitoring & Early Warning on Kuala Lumpur, Sarawak ports, and Johor logistics corridors will surface emerging unrest, labor action, or cross-border friction before operational impact. Network & Actor Analysis of Malaysian government, banking, and opposition figures clarifies institutional risk and sanctions/enforcement likelihood for international partners.
7-Day Outlook
Near-term trajectory remains stable; current signals reflect institutional and regulatory tension rather than public unrest or security breakdown. Monitor for escalation in government-sector disputes or regulatory enforcement intensity affecting cross-border operations. Expect continued government and industry public positioning, with potential for incremental policy announcements affecting financial-services and trade-dependent sectors in KL and Sarawak.
Highest-Risk Areas — Ranked
| # | State / Region | Risk |
|---|---|---|
| 1 | Kuala Lumpur | 31.7 |
| 2 | Sarawak | 25.7 |
| 3 | Johor | 18.7 |
| 4 | Kedah | 13.7 |
| 5 | Terengganu | 4.7 |
| 6 | Perlis | 3.7 |
| 7 | Negeri Sembilan | 3.7 |
| 8 | Kelantan | 2.7 |
| 9 | Selangor | 2.7 |
| 10 | Penang | 1.7 |
| 11 | Perak | 1.7 |
| 12 | Pahang | 1.7 |
Previous Daily Briefs
A new Malaysia brief is written every day — each with its own risk map and downloadable CSV. Here's the last week; use the calendar to go further back.
📅 Browse every day by calendar →
Highlighted days have a brief. Tap a day for that day's map & analysis, or “csv” for that day's dataset ($5).