Situation Summary
Netherlands maintains a composite threat score of 26 (globally unranked) with 9 tracked events over the monitoring period. Risk is heavily concentrated in South Holland (score 31.3), particularly Amsterdam, which accounts for the majority of recent incident activity. A cluster of public statements, administrative actions, and law-enforcement operations—spanning Amsterdam-specific disputes, cross-border detentions with Italy, and prosecutorial actions—signals localized friction rather than systemic instability. The security environment remains fragmented by geography, with 10 of 12 provinces at baseline risk (1.3).
Key Developments
- Amsterdam, 2026-07-25 – Conventional military force event involving American personnel and U.S. interest; no casualty or operational detail confirmed in available sources. Warrants clarification on nature and scale.
- Amsterdam, 2026-07-23 – Public statement escalation involving scientist and city administration; context and substantive dispute unconfirmed pending corroborated reporting.
- Nationwide, 2026-07-23 – Dutch authorities imposed administrative sanctions on government entity or official(s); rationale and enforcement scope unclear from event summary alone.
- Amsterdam, 2026-07-24 – Multiple public statements from criminal element(s) and institutional respondents (city, national authorities); suggests reactive law-enforcement messaging around one or more underlying incidents.
- Amsterdam, 2026-07-24 – Staff member issued public statement directed at prosecutor; potential sign of internal institutional friction or whistleblowing activity.
- Nationwide, 2026-07-25 – Prosecutor-Venezuela relations reduced; likely diplomatic/sanctions consequence rather than security incident, but may constrain cooperation channels.
- Nationwide, 2026-07-25 – Netherlands executed arrest/detention operations against Italian nationals or interests on two occasions; cross-border law-enforcement action suggests crime/smuggling investigation ongoing.
Note: Web research over the last 24–48 hours did not yield corroborated, independently sourced incident details sufficient to expand this section without attribution gaps. A targeted search refresh is recommended.
Highest-Risk Areas
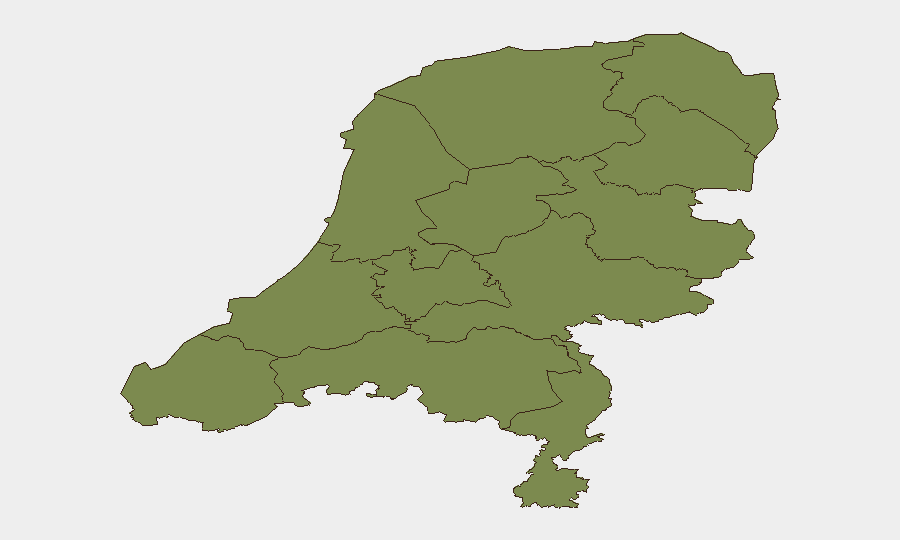
South Holland dominates the national risk profile (31.3, nearly 6× higher than second-ranked region). Amsterdam within South Holland is the epicenter, showing concentrations of public-order incidents, criminal statements, and administrative action on 2026-07-23 and 2026-07-24. North Holland (11.3) is secondary but notably lower, suggesting the threat is highly localized to Rotterdam–Amsterdam metro and city governance vectors rather than regional. All remaining provinces cluster at baseline (1.3), indicating limited concurrent security events outside the two Holland provinces. Risk drivers appear institutional (prosecutorial, administrative), criminal (statements attributed to organized elements), and transient (military-related event of unclear scope) rather than protest-driven or structural.
How GeoBit Would Assist
Intel Sweep & OSINT fusion would correlate the fragmented event signals (public statements, sanctions, arrests) into a coherent timeline and actor network, surfacing relationships between Amsterdam-based criminal groups, prosecutors, and institutional respondents. X/Twitter & multi-language OSINT combined with sentiment analysis would track real-time public discourse around the July 23–25 incidents, identifying emerging tensions or coordinated narratives. AOI monitoring & early-warning on South Holland and Amsterdam, configured for arrest/detain events, public unrest, and criminal-justice signals, would alert teams to escalation before it reaches secondary provinces.
7-Day Outlook
The localized cluster of events in Amsterdam and South Holland is expected to persist through administrative/prosecutorial resolution, likely 5–14 days. No intelligence suggests expansion to secondary regions or systemic instability. Teams with assets or personnel in Amsterdam should monitor local media and prosecutor statements; those in North Holland and other provinces face minimal near-term disruption risk.
Highest-Risk Areas — Ranked
| # | State / Region | Risk |
|---|---|---|
| 1 | South Holland | 31.3 |
| 2 | North Holland | 11.3 |
| 3 | Utrecht | 2.6 |
| 4 | Flevoland | 1.3 |
| 5 | Zeeland | 1.3 |
| 6 | North Brabant | 1.3 |
| 7 | Frisia | 1.3 |
| 8 | Groningen | 1.3 |
| 9 | Drenthe | 1.3 |
| 10 | Gelderland | 1.3 |
| 11 | Overijssel | 1.3 |
| 12 | Limburg | 1.3 |
Sources
Previous Daily Briefs
A new Netherlands brief is written every day — each with its own risk map and downloadable CSV. Here's the last week; use the calendar to go further back.
📅 Browse every day by calendar →
Highlighted days have a brief. Tap a day for that day's map & analysis, or “csv” for that day's dataset ($5).
Atlas — our AI intelligence desk — emails them this snapshot personally. Nothing else, no list.