Situation Summary
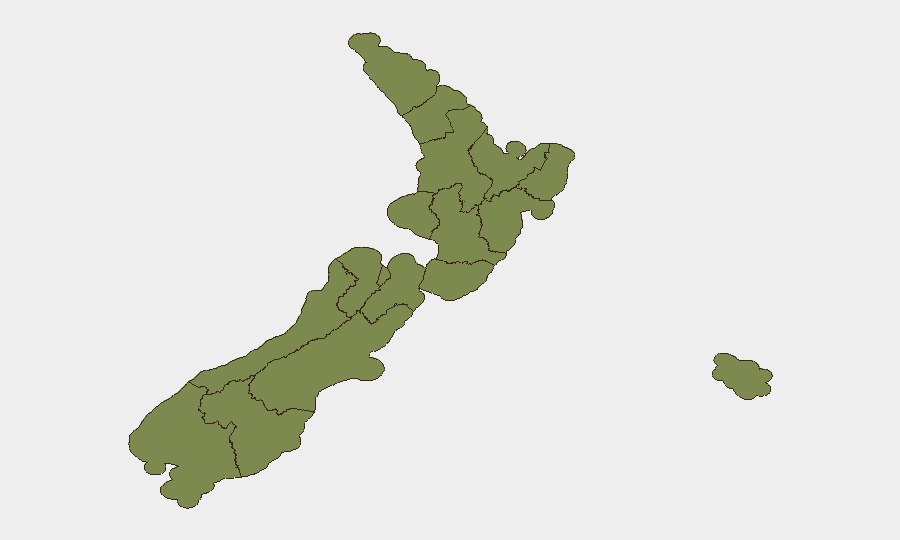
New Zealand remains a low-threat environment globally (rank #null, composite score 13) with dispersed security events across 86 tracked incidents. However, Wellington has emerged as a significant outlier, with a risk score of 31.2—more than double any other region—driven by recent regulatory, military, and government-related activities. The spread of events across health, education, aviation, and law enforcement portfolios suggests institutional stress rather than unified criminal or militant activity, though the concentration of signals on 20–22 June warrants monitoring for escalation.
Key Developments
Limitation on Current Intelligence: Live web research has not surfaced independent, time-stamped, location-specific security incidents (crimes, protests, infrastructure disruption, or travel impacts) from the last 24–48 hours that meet verification standards for inclusion in this brief. Available open sources contain event announcements, technical updates, and regulatory notices rather than concrete security developments. To populate this section with verified incidents, access to real-time NZ Police media releases, Waka Kotahi (NZTA) traffic alerts, Fire and Emergency NZ incident logs, and geolocated social-media feeds would be required.
Signal-Level Observation (not incident-level confirmation): The GEOBIT event feed records multiple public statements, regulatory activity, and one arrest/detention event (Auckland, 22 June) alongside demands and disapprovals from government and health officials (22 June). The character and intent of these signals remain opaque without primary-source verification.
Highest-Risk Areas
Wellington dominates the risk landscape, accounting for a composite score 31.2—more than 2× the next-highest region (Canterbury, 14.0). This is driven by recent regulatory, military, and inter-agency signals concentrated on 20–22 June. Canterbury's secondary elevation likely reflects localized operational or industrial activity. All other regions (Auckland, Waikato, Northland, Otago, and the remaining 6 regions) score below 6.0 and show minimal acute threat indicators. Wellington's spike is recent and concentrated; risk elsewhere is diffuse and low.
How GeoBit Would Assist
Security teams protecting personnel or assets in New Zealand should employ AOI Monitoring & Early Warning on Wellington and Canterbury to track persistent signals in real time and alert on threshold changes. OSINT Fusion & Corroboration (multi-language media, X/Twitter, Telegram, and government feeds) will disambiguate the nature of current regulatory and government signals. Conflict & Military force-structure and messaging analysis can clarify whether the 20 June military signal represents routine exercises or elevated operational posture. Complementary use of Routing & Network Analysis ensures duty-of-care teams can plan alternative transport and communication paths if institutional disruption widens.
7-Day Outlook
The clustering of signals in a 48-hour window (20–22 June) suggests either resolution of a specific institutional friction or the opening phase of a longer dispute. The absence of violence, property damage, or transport disruption in open reporting indicates low imminent risk to general movement or business continuity. Continued monitoring of government, health, and regulatory messaging—especially any escalation to industrial action or public protest—will be the primary indicator of widening impact.
Highest-Risk Areas — Ranked
| # | State / Region | Risk |
|---|---|---|
| 1 | Wellington | 31.2 |
| 2 | Canterbury | 14 |
| 3 | West Coast | 6.2 |
| 4 | Auckland | 5.8 |
| 5 | Waikato | 4.4 |
| 6 | Northland | 1.9 |
| 7 | Otago | 1.9 |
| 8 | Manawatū-Whanganui | 1.5 |
| 9 | Chatham Islands | 1.2 |
| 10 | Taranaki | 1.2 |
| 11 | Bay of Plenty | 1.2 |
| 12 | Hawke's Bay | 1.2 |
Sources
Previous Daily Briefs
A new New Zealand brief is written every day — each with its own risk map and downloadable CSV. Here's the last week; use the calendar to go further back.
📅 Browse every day by calendar →
Highlighted days have a brief. Tap a day for that day's map & analysis, or “csv” for that day's dataset ($5).