Situation Summary
Papua New Guinea remains a fragmented security environment with pronounced regional variation; Morobe Province dominates the national threat picture with a composite risk score nearly 10× higher than any other state. The country faces concurrent pressures from localised territorial disputes, seismic activity (two earthquakes >4.5M in recent days), and vaccine-derived poliovirus circulation. No major security incidents were reliably confirmed across open sources in the last 24–48 hours, though the operational environment remains volatile in key provinces.
Key Developments
- 2026-06-18 · Territory Occupation · Location unspecified. An occupancy dispute was reported; geographic specificity and involved parties require verification against PNG provincial government and local media channels.
- Seismic Activity · Multiple Events (Recent). M4.8 earthquake 65 km south of Kokopo (East New Britain) and M4.6 event 78 km west of Panguna (Bougainville). Neither triggered tsunami warnings or confirmed major casualties, but infrastructure and supply-route vulnerability in affected zones warrants asset inventory review.
- Public Health · cVDPV2 Circulation. Circulating vaccine-derived poliovirus type 2 continues to circulate in Papua New Guinea. No new outbreak sites or case counts from the last 48 hours were accessible; monitoring of Ministry of Health advisories is recommended for personnel in remote/low-coverage areas.
- Open-Source Intelligence Gap. No additional security incidents (conflict, civil unrest, crime, political instability) were confirmed across reliably dated open sources in the last 24–48 hours. This does not indicate absence of risk; rather, reporting latency and media coverage limitations in PNG mean incidents may not surface for 48–72 hours post-occurrence.
Highest-Risk Areas
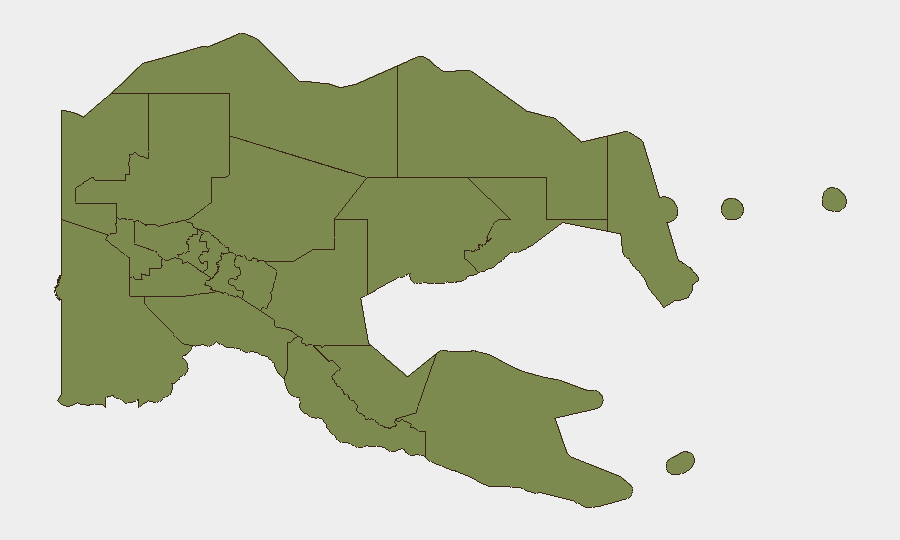
Morobe Province (risk score 31.3) accounts for the overwhelming majority of tracked threat indicators and is the singular focus of PNG national security concern. Eastern Highlands, Gulf, Madang, and Manus round out the secondary tier, each with scores between 1.3 and 3.1; Manus (3.1) merits particular attention relative to peers. The risk differential suggests Morobe is subject to higher-frequency lower-level incidents (petty crime, clan disputes, informal taxation) rather than catastrophic events; however, cumulative operational friction for personnel and supply chains in that province is substantial. All other provinces, including the National Capital District (Port Moresby), register at baseline (1.3), reflecting relatively stable but institutionally weak governance.
How GeoBit Would Assist
Security teams should deploy AOI Monitoring & Early Warning on Morobe, Manus, and Eastern Highlands to generate alerts on incident clustering and temporal trends. Intel Sweep and X/Twitter OSINT (filtered by location, date, and verified PNG media/government accounts) will surface ground-truth incident reports 24–48 hours faster than mainstream wires. GIS & Spatial Analysis linked to asset inventories allows real-time routing and personnel-movement risk scoring around confirmed trouble zones; Routing & Network Analysis supports contingency journey planning for staff in or transiting Morobe.
7-Day Outlook
No major policy shifts, election cycles, or seasonal conflict escalation patterns are expected in the next week. Seismic activity will likely decline to background levels; poliovirus surveillance will continue. Territorial and clan-driven incidents in Morobe are expected to persist at baseline frequency. Risk profile remains stable but operationally taxing for teams with presence in high-risk provinces.
Highest-Risk Areas — Ranked
| # | State / Region | Risk |
|---|---|---|
| 1 | Morobe | 31.3 |
| 2 | Manus | 3.1 |
| 3 | Eastern Highlands | 1.3 |
| 4 | Gulf | 1.3 |
| 5 | Madang | 1.3 |
| 6 | West New Britain | 1.3 |
| 7 | New Ireland | 1.3 |
| 8 | East New Britain | 1.3 |
| 9 | National Capital District | 1.3 |
| 10 | Central | 1.3 |
| 11 | Oro | 1.3 |
| 12 | Milne Bay | 1.3 |
Sources
Previous Daily Briefs
A new Papua New Guinea brief is written every day — each with its own risk map and downloadable CSV. Here's the last week; use the calendar to go further back.
📅 Browse every day by calendar →
Highlighted days have a brief. Tap a day for that day's map & analysis, or “csv” for that day's dataset ($5).