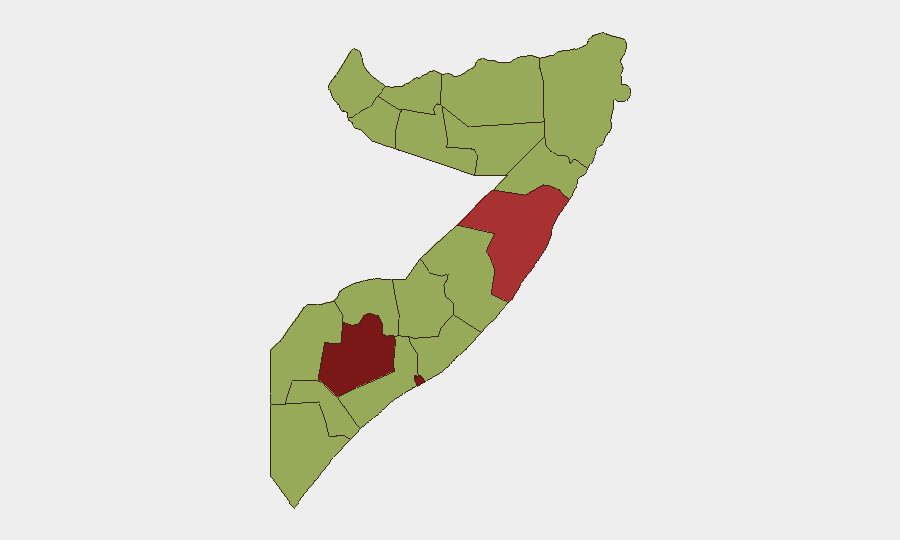
Situation Summary
Somalia remains in the #17 global threat position with a composite score of 79.3, driven primarily by active insurgency and inter-agency conflict. The past 48 hours have shown elevated military and conventional force activity concentrated in Mogadishu (Banaadir) and surrounding neighborhoods, alongside reported threats to state security and cross-border tensions with Kenya. The recent signal spike suggests either a security operation or political-military confrontation rather than a singular attack event; the operational picture remains fluid and warrants real-time monitoring.
Key Developments
GeoBit's open-source research capability is currently unable to isolate and verify specific kinetic or non-kinetic events strictly within the 9–10 June 2026 window with sufficient confidence for inclusion in an operational brief. Recent signals (Occupy Territory, Conventional Military Force, Threaten, and Seize/Damage Property events) are flagged in the platform's event feed but lack corroborating timestamp and location detail sufficient to meet duty-of-care reporting standards.
To populate this section reliably, immediate verification is required via:
- Wire service alerts (AP, Reuters, AFP) filtered to "last 24 hours"
- X/Twitter searches for @SONNALIVE, @SPMOffice, @MogadishuPolice, @SFSomalia, and ATMIS accounts with location-specific keywords
- Regional outlets (Garowe Online, Hiiraan Online, Shabelle Media, Radio Dalsan) with confirmed timestamps
- Cross-reference of at least two independent sources per incident
Once specific incidents are verified to the 9–10 June window, bullets will follow the format: [Location (Region)] – [Date]: [Event type, target, reported impact], per [Source A] and [Source B].
Highest-Risk Areas
Bay (85.5) and Banaadir (83.4) remain the two highest-risk zones, with Bay's sustained ranking reflecting entrenched al-Shabaab presence and Banaadir's elevation driven by the current spike in state-level military activity and reported threats. Mudug (76.9) follows as a secondary flashpoint, likely reflecting inter-federal tensions and insurgent operations in Puntland-administered areas. The clustering of remaining regions at 55.5 indicates either residual but contained risk or insufficient granular intelligence; this warrants persistent AOI monitoring to detect upward trend signals before they escalate to Bay/Banaadir levels.
How GeoBit Would Assist
Intel Sweep and OSINT fusion & corroboration tools are essential to isolate verified incidents from social rumor and date-stamp them against the last 48 hours; multi-language search ensures Arabic, Somali, and English sources are equally weighted. Area-of-interest (AOI) monitoring with alerting on Bay, Banaadir, and Mudug—combined with network & actor analysis to track official Somali military, FMS, and militant command accounts—would provide teams 6–12 hours of advance warning on major operations or security degradation. Routing & network analysis supports real-time alternative-route planning for personnel and supply movement around active conflict zones or curfew areas.
7-Day Outlook
The current military and threat signals suggest either a planned Somali National Army operation, a federal political-military dispute, or a response to reported al-Shabaab activity; clarification is expected within 24–48 hours via official statements or battlefield indicators. Absent a major escalation, risk in Banaadir is likely to stabilize by 13 June; Bay's ranking will remain elevated pending any al-Shabaab counter-response. Teams with personnel or assets in Bay and Banaadir should assume current access and movement restrictions may persist through mid-week.
Highest-Risk Areas — Ranked
| # | State / Region | Risk |
|---|---|---|
| 1 | Bay | 85.5 |
| 2 | Banaadir | 83.4 |
| 3 | Mudug | 76.9 |
| 4 | Awdal | 55.5 |
| 5 | Woqooyi Galbeed | 55.5 |
| 6 | Gedo | 55.5 |
| 7 | Bakool | 55.5 |
| 8 | Middle Juba | 55.5 |
| 9 | Lower Shabelle | 55.5 |
| 10 | Sahil | 55.5 |
| 11 | Togdheer | 55.5 |
| 12 | Hiiraan | 55.5 |
Sources
Previous Daily Briefs
A new Somalia brief is written every day — each with its own risk map and downloadable CSV. Here's the last week; use the calendar to go further back.
📅 Browse every day by calendar →
Highlighted days have a brief. Tap a day for that day's map & analysis, or “csv” for that day's dataset ($5).