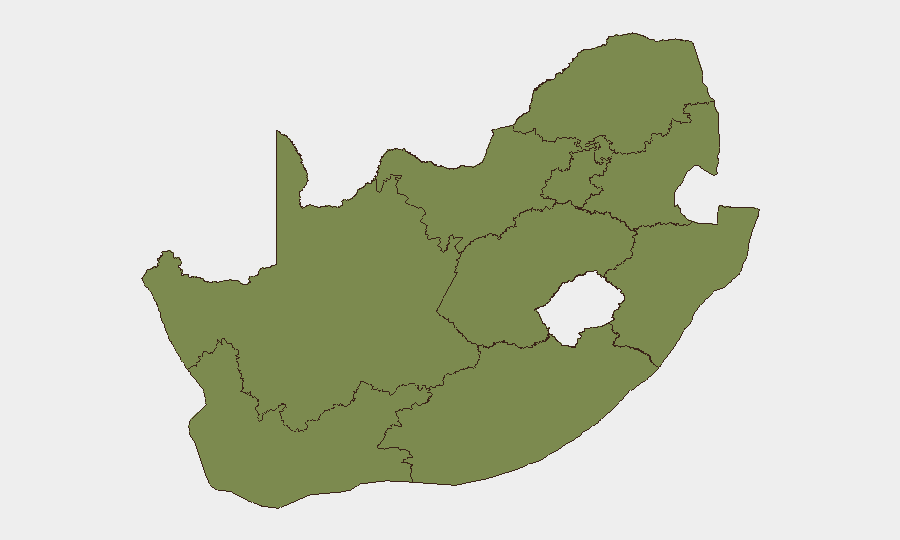
Situation Summary
South Africa remains at moderate composite threat level (#61 globally, score 19) with significant sub-national variance. Gauteng dominates the risk profile at 32.8, reflecting urban crime, service-delivery protests, and sporadic civil unrest; KwaZulu-Natal and Free State follow at 17.3 and 16.8 respectively. Recent event signals point to xenophobia-related tensions, police confrontations with foreign nationals, student and public-sector demonstrations, and governance investigations, with ministerial statements on border enforcement and irregular migration issued 3 July 2026.
Key Developments
GeoBit's event signals for 2–3 July 2026 indicate:
- Violent protest/riot involving police and foreign nationals (2 July, location and casualty count unconfirmed in available summaries) — reflects ongoing xenophobic friction and enforcement operations.
- Student and public-sector demonstrations (2 July, likely Gauteng-based given historical concentration) — consistent with service-delivery grievance cycles.
- Cabinet statement on border enforcement and irregular-migration crackdowns (3 July) — includes Limpopo–Zimbabwe border inspections (2 July) and expanded labour-site inspections, signalling heightened state action against undocumented populations.
- Ministerial rejection of pan-African governance interventions (2 July) and public statements from ministerial entities (3 July) — suggest diplomatic tension and defensive posture on sovereignty and immigration policy.
- Foreign-national threat statements and immigrant-actor threats (2–3 July, specific targets and locations not yet clarified) — potential indicator of retaliatory rhetoric or organized grievance mobilization.
- Governance investigation initiated (3 July, portfolio and scope not yet specified in available signals).
*Note: Precise incident locations, times, and multi-source corroboration remain pending; the above summarizes GeoBit event taxonomy flags rather than independently verified field incidents.*
Highest-Risk Areas
Gauteng (32.8) is the primary driver, reflecting Johannesburg and Pretoria's concentration of urban crime, xenophobic violence, service-delivery protests, and police operations. KwaZulu-Natal (17.3) and Free State (16.8) show elevated risk from civil unrest, gang activity, and inter-community conflict. Western Cape (8.3) remains substantially lower despite Cape Town's crime challenges, suggesting improved enforcement or reduced protest activity relative to the eastern interior. All other provinces register single-digit risk scores, indicating that corporate exposure in Limpopo, Mpumalanga, North West, Northern Cape, and Eastern Cape is materially lower on current GeoBit metrics, though localized incidents remain possible.
How GeoBit Would Assist
Corporate security teams operating in South Africa should deploy AOI Monitoring & Early Warning on Gauteng and KwaZulu-Natal focal points (city centres, industrial zones, border regions) to receive real-time alerts on protest activity, xenophobic flashpoints, and police operations. Intel Sweep with multi-language OSINT, X/Twitter OSINT, and sentiment analysis will track emerging grievances, ministerial policy shifts, and actor threats before they escalate to physical incidents. Network & Actor Analysis can map xenophobic organizers, labour unions, and enforcement agencies to anticipate secondary cascades in response to border crackdowns or governance investigations.
7-Day Outlook
Heightened border enforcement and labour-site inspections will likely sustain foreign-national grievance and potential retaliatory mobilization through early-to-mid July. Student and public-sector demonstrations are expected to continue on typical service-delivery cycles. Xenophobic tensions remain elevated and episodic; further police confrontations are possible if demonstrations and immigrant-community friction converge geographically or temporally.
Highest-Risk Areas — Ranked
| # | State / Region | Risk |
|---|---|---|
| 1 | Gauteng | 32.8 |
| 2 | KwaZulu-Natal | 17.3 |
| 3 | Free State | 16.8 |
| 4 | Western Cape | 8.3 |
| 5 | Eastern Cape | 5.9 |
| 6 | Limpopo | 3.9 |
| 7 | Mpumalanga | 3.2 |
| 8 | North West | 3 |
| 9 | Northern Cape | 2.8 |
Sources
Previous Daily Briefs
A new South Africa brief is written every day — each with its own risk map and downloadable CSV. Here's the last week; use the calendar to go further back.
📅 Browse every day by calendar →
Highlighted days have a brief. Tap a day for that day's map & analysis, or “csv” for that day's dataset ($5).
Atlas — our AI intelligence desk — emails them this snapshot personally. Nothing else, no list.